


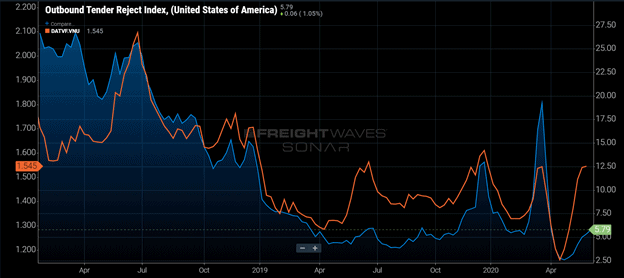
Chart of the Week: Outbound Tender Rejection Index – USA, DAT Longhaul Van Rate – National SONAR: OTRI.USA, DATVF.VNU
Anything that provides immediate, intense gratification typically comes at a high cost. The cost of the 2017-18 freight boom has lasted for nearly two years. Spot rates, which are a good measure of capacity fluctuations in the domestic trucking market, grew as fast as they ever have in 2017-18, culminating at a peak around the Fourth of July in 2018. Not only were volumes growing at a surprising pace, but they sustained for an unusually long period of time above contracted levels. In its wake, this market has left the domestic trucking industry with an oversupply problem that has still not been resolved — which is not easy to see amid the ongoing crisis that has been 2020.
Tender rejection rates, which measure carrier compliance, were in excess of 20% through most of the first half of 2018. By comparison, the average rejection rate was around 6% in 2019, leading to massive spot market deterioration.
To the casual observer, the drop-off in rejection rate might imply a significant reduction in volumes, and there was some level of deterioration in the first half of the year. According to the national Outbound Tender Volume Index (OTVI), volumes were off roughly 3% from March through June last year. But in the second half of 2019, volumes actually showed a 3.7% year-over-year (y/y) increase over 2018.
The reason rejection rates were not as responsive to increasing volumes is twofold — increase in capacity and the largest contract rate increase in over a decade. Both of these factors seem good for the health of the industry. Increase in capacity is indicative of more volumes while increasing contract rates means more revenue. The problem was/is that the rate of increase in both was too great.
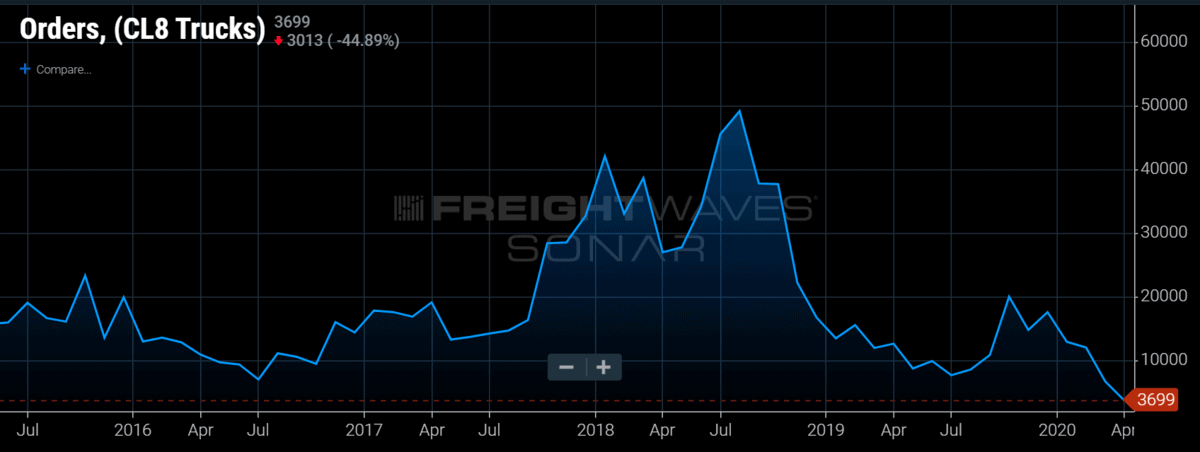
Looking at class 8 truck orders over the past five years, there is an obvious spike that occurred at the beginning and middle of 2018 — 76% higher than 2017. New truck orders typically come from larger carriers that have the capital to invest in new equipment. Most of these orders did not hit the road until 2019 due to the six- to nine-month production cycle. Once they did, volumes had already normalized.

The Cass Truckload Linehaul Index measures the average truckload cost excluding fuel with a base value of 100. The index increased over 10% from July 2017 to July 2018, implying the fastest rate of truckload cost increase since the index began in 2005.
As the COVID-19 pandemic was hitting, the freight market was still feeling the effects of an oversupplied market with a very subdued spot market. Even as volumes hit levels above 2018, spot market activity remains suppressed in relation. This is not 100% due to the 2018 run on capacity, but even before the shelter-at-home orders began, pricing was already being rolled back, according to the Cass Truckload Linehaul Index, which fell 6% y/y.
The COVID-19-inspired Payroll Protection Program may actually delay the market from reaching a healthier equilibrium and resuming a more sustainable growth rate by keeping capacity in the market longer than necessary. Carriers who were struggling prior to the outbreak got a lifeline for a few months, but spot and contract rates are still down, meaning they will have to fundamentally change if they want to remain in the market.
About the Chart of the Week
The FreightWaves Chart of the Week is a chart selection from SONAR that provides an interesting data point to describe the state of the freight markets. A chart is chosen from thousands of potential charts on SONAR to help participants visualize the freight market in real time. Each week a Market Expert will post a chart, along with commentary, live on the front page. After that, the Chart of the Week will be archived on FreightWaves.com for future reference.
SONAR aggregates data from hundreds of sources, presenting the data in charts and maps and providing commentary on what freight market experts want to know about the industry in real time.
The FreightWaves data science and product teams are releasing new data sets each week and enhancing the client experience.
To request a SONAR demo, click here.
