Seattle is a black hole for trucks right now
The alteration in container freight flows since the holiday season has hit Seattle the hardest. According to a Susquehanna research note released Monday, Seattle is the only West Coast port with negative growth in container volume for 2018. For 2018 year-to-date, Los Angeles has grown 7.9%, Long Beach has grown 16.7%, and Oakland grew 2.4%, while Seattle contracted by 22.8% to start off the year.
Seattle is starved for freight, and carriers are desperate, willing to take very low rates to reposition their trucks out of the region. According to DAT, the Seattle market is offering just 1.3 loads per truck (and this number normally runs higher because of a discrepancy in the rate of loads vs. trucks posted to loadboards).
DAT’s Rateview data show that dry vans outbound from Seattle are generating much less revenue on the spot market than they were even a month ago. We’ll look at DAT dry van rates in three lanes: Seattle to Los Angeles, Seattle to Boise, and Seattle to Salt Lake City. Spot rates from Seattle to Los Angeles have dropped 27.8% since December, from $1.58 per mile to an average of $1.14 per mile over the past seven days. Spot rates from Seattle to Boise fell 14% since December, from $2.35 per mile to an average of $2.02 per mile over the past seven days. Spot rates from Seattle to Salt Lake City decreased 23.6% since December, from $2.41 per mile to an average of $1.84 per mile over the past seven days.
Now that apple season is over, reefer rates outbound from Seattle have suffered an even more profound collapse than the dry vans. DAT’s Rateview shows that outbound reefer rates from Seattle to Los Angeles have fallen 35.6% since December, from $2.27 per mile to an average of $1.46 per mile over the past seven days.

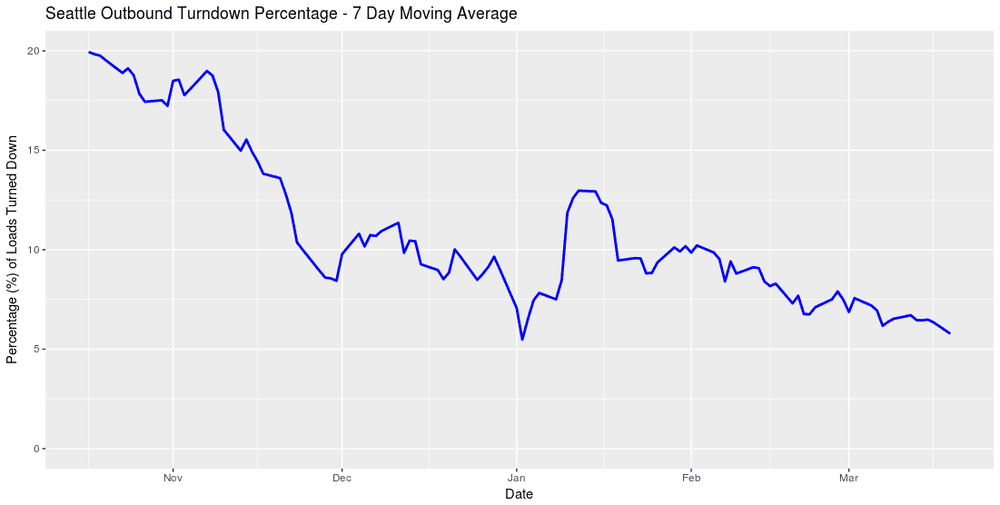
FreightWaves’ proprietary metrics give further insight into what’s happening in the Seattle freight market. The chart above shows the outbound Seattle turndown rate (rejected loads as a percentage of total loads). Turndowns reached a peak of 20% of all loads in mid-October as spot rates strengthened—carriers were shopping around in the expectation of securing higher rates to move their trucks. Since then, the Seattle freight market has essentially collapsed. Now only about 5% of loads are being rejected by carriers, despite extremely low spot rates. We monitor tender turndowns because it is a leading indicator of overall market health and demonstrates route guide compliance. A tender happens when a shipper attempts to send a load to a carrier. The carrier electronically can either accept or reject that load. These transactions are reflective of actual electronic shipments, not searches or voice quotes. The larger carriers and brokers usually have first dibs on freight in any market and monitoring these transactions give us a sense for how healthy (or unhealthy) a market is. When you are only at a 5% rejection rate it shows that trucks are essentially fighting over scraps in order to leave Seattle.
FreightWaves data scientists also aggregate tender-lead times. We’ve found that tender/lead times shortened from about 3.1 days at the end of February to just under 2.6 days as of March 19. Shortening durations between when a load is tendered and when shippers want it picked up indicates shippers’ attitudes toward rate volatility and capacity. In Seattle’s softening rate environment, with a very low load-to-truck ratio, shippers are confident they can find trucks on short notice and are moving the few loads they do have fairly quickly to exploit favorable prices.
Stay up-to-date with the latest commentary and insights on FreightTech and the impact to the markets by subscribing.
