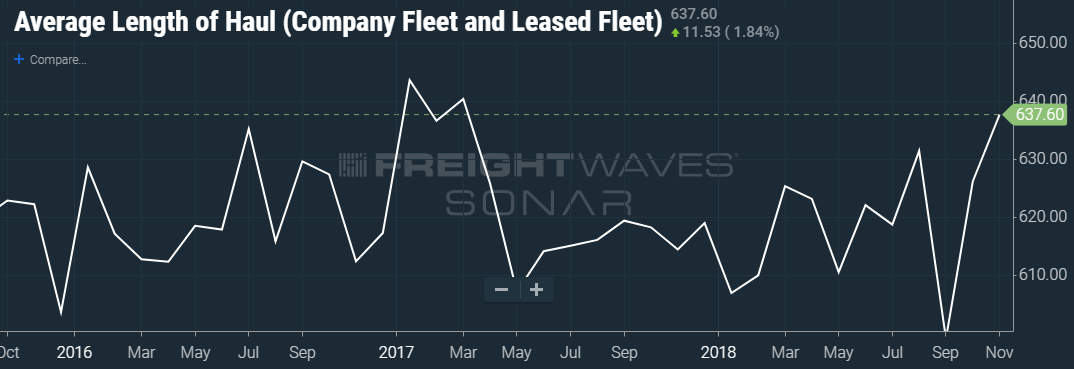
CHART: TCA data houses inside FreightWaves’ SONAR
Average length of haul has been trending up since October 2018, according to TCA data housed inside FreightWaves’ SONAR. The data indicates average length of haul came in at 626 miles in October 2018, then climbed to 638 miles in November 2018.
TCA’s average length of haul data is collected from a sample of asset-based carriers that participate in TCA Best Practice Groups.
November’s 638-mile average length of haul was up about 6 percent from an anomalous dip to 599 miles in September. November’s number was up about 1 percent from August’s 631 miles.
The upward trend in average length of haul is contrary to what one may expect as prominent companies open more distribution centers across the nation in an attempt to shorten the time it takes for goods to travel to consumers, who expect quicker delivery than ever before.
“Average length of haul increasing is interesting considering many companies, like Home Depot, have been focusing on shortening the distance from distribution center to end users in order to decrease the amount of time between order and final delivery,” FreightWaves Senior Analyst Zach Strickland said. “One possible explanation is the record inbound container volumes that came in from China to Southern California in the second half of 2018 due to concerns over tariffs. Many of those shipments were bound for the eastern half of the country.”
Late 2018’s tariff frenzy is also expected to have contributed to climbing revenue per driver per week, which reached a record high in last fall, jumping 6 percent from $3,659 to $4,256, between September and October, according to TCA data inside FreightWaves’ SONAR.
CHART: TCA data houses inside FreightWaves’ SONAR
The spike in revenue per driver per week came alongside record container volumes at the Los Angeles, California ports. Both Los Angeles and Long Beach experienced a standout October in terms of loaded inbound container volume, coming in 17.6 percent higher than 2017, causing outbound L.A. volumes to exceed peak summer levels into the fall season.
“Intermodal hubs like Chicago saw outbound volumes surge over inbound volumes as containers got off the rail in the Midwest and were distributed throughout the eastern half of the country,” Strickland said. “The Headhaul index for Chicago (HAUL.CHI) – which measures the amount of outbound minus inbound volume – hit its highest point in the first week of October of 67.24 when the rest of the freight market was dropping. A positive Headhaul Index value indicates outbound trucking volume exceeds inbound volume.”
Many of the final destinations for this intermodal freight were not serviced by railroads, so the freight found its way onto trucks. High volumes headed to farther destinations provide the ideal environment for both revenue per driver per week and average length of haul to climb.
