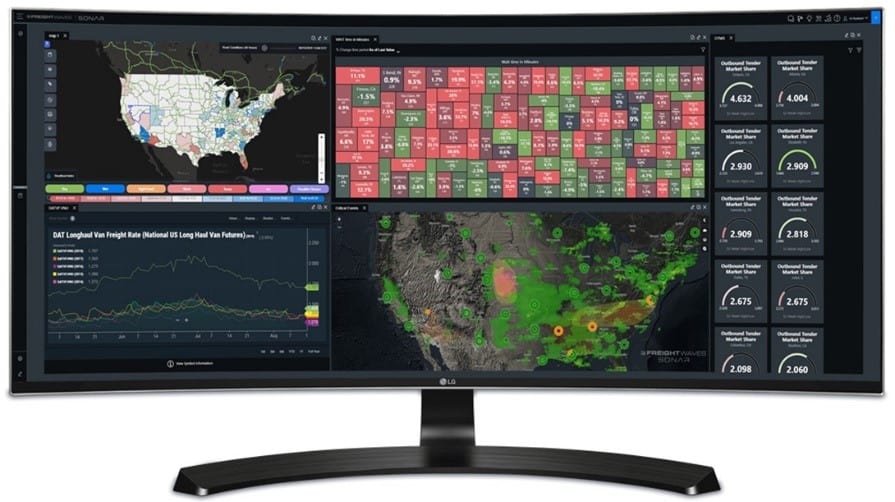
The digital age of searching, finding and then using market intelligence for competitive advantage to grow your market importance is upon us.
Going back four decades to my Urban Goods Movement and state freight research days, every transport mode “flew blind.” Data that segmented and defined the market back then was always retrospective. That means both historical and vague.
High-level policy, regulatory and strategic planning across modes – or for competitive purposes – was a challenge back then. Broad state-to-state traffic pattern analysis was the best granular geographic intelligence.
There was no “now” timeline. Business projections to some out year was based on an aged baseline year.
Move forward to today. There is a new intelligence sheriff in town.
FreightWaves has created a platform for customers and carriers to interact in near-time. Named SONAR, it offers an intelligence view of U.S. freight that is agnostic (neutral) in regard to the competing mode.
It sits on your supply chain management desk. It gives both carriers and shippers the same view of “what’s going on across the modes and the strategic geographic markets today.”

How does this fit with railroad freight?
The market image is that the railroad industry is inwardly focused as to market flows and competitive intelligence. It offers silo views to customers and to policy agencies of what is happening.
The hypothesis is that this isolation is occurring with increasingly sophisticated freight buyers.
Investing to build its own railway sector selling and buying digital platform might be a tactic too late. It takes both money and research and development time to build, test and prove a better service communications platform.
This isn’t just a U.S. rail freight challenge. Europe and every railroad-served continent are behind the eight-ball in freight transparency and descriptors of railway relevance.
Clearly, the market intelligence platform to beat is the FreightWaves SONAR platform.
What is this SONAR thing?
It’s a third-party desktop view deep into and across modes that move supply chains of goods across geographic markets.
It is not a consulting service. Instead, consider it a library of data science-constructed tables and graphs about real markets in as near-real time reporting as possible.
First developed to examine the huge trucking, highway flows and warehousing logistics enterprise patterns, the SONAR platform is now expanding into the SaaS view of railroad freight.
What’s SaaS?
It’s “software-as-a-solution” data of all kinds – sliced and diced freight activity that compares competitive places and competitive modes.
Subscribers can view different modes and even intra-mode competition across multiple origin/destination flows. SONAR can be integrated with a railroad company’s own proprietary data sets. It connects the former silos.
State transport and federal agencies can also use SONAR to see the market in ways they’d always hoped to – but couldn’t figure out the ‘how to.’ They lacked the right data science skills.
Becoming a packaged buyer of a service now allows railroads the option of leap-frogging forward into the digital insight age.
Here are a few close-up examples of what railroad managers could see as quickly as within about a week, if they perceived the intelligence value. By using SONAR, you’d elect to outsource part of your strategic business intelligence to SONAR SaaS agents.
The “heat map” above is just one example of how SONAR offers insight on dwell times. Not from a week ago. It’s current dwell times. This is what freight shippers and receivers see today in the trucking world and now in parts of the intermodal terminal world.
Another SONAR plot is the freight futures market forecast. It is a predictor of how customers are hedging their outlook at trucking services. Could there be a carload rail freight futures market someday soon? Who knows?
This exhibit identifies current spot rates in the Chicago to Atlanta corridor at $1.55/mile, while futures contracts for the lane are being bid at $2.05/mile out towards November and $2.06/mile in December. Separately, intermodal rates for the same lane (INTRM.CHIATL) are priced at $1.86/mile.
Other data sources allow the computation and graphing of future national predicted price levels like this one for flat vans out into early 2020.
In summary, there is a rich coverage of freight activity across trucking, warehousing, third-party logistics providers and maritime that is expanding into the U.S. railroad freight sector. Old-timers may see this as disruptive of previous railroad business manners. I see this as an opening for a much more informed business environment that directly engages with rail customers.
Ironically, increased transparency may make it less likely for regulatory rail freight oversight. Why? If you believe in the open market philosophy of commerce, more transparency allows the buyers and sellers to act with better informed positions.
Two strategic questions are – “How will the railroads fit into these SONAR platforms or others that may emerge?” and “How long for an intelligence transition?”
This business case has been independently offered based upon my long railroad logistics and IT career experience. My opinion is part of my teaching practice and notes. As always, your counterpoints are welcomed.
