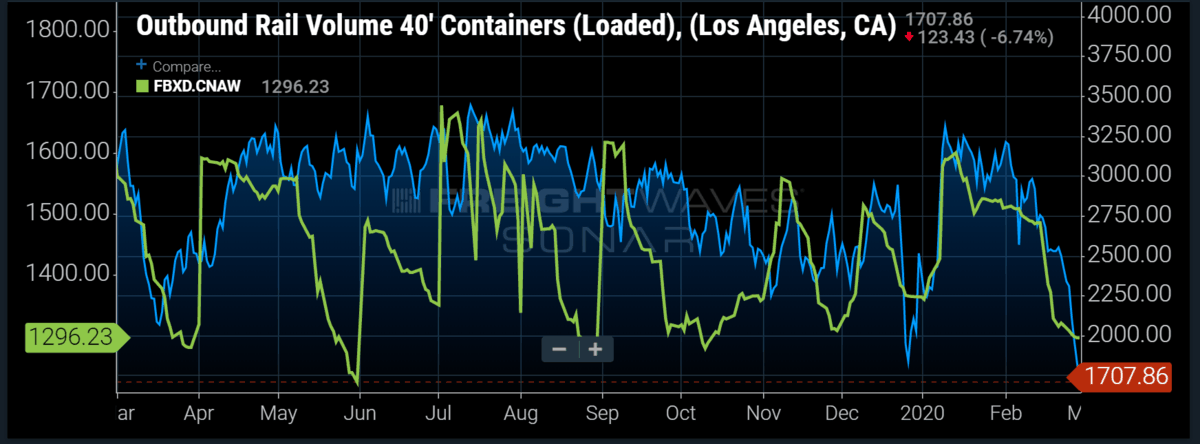
Chart of the Week: Outbound volume of 40-foot loaded containers from Los Angeles versus the Freightos Baltic Daily Index from China to the U.S. West Coast SONAR: ORAIL40L.LAX, FBXD.CNAW
Following one of the worst weeks in the stock market, questions about the impact of the coronavirus on supply chains abound. Will there be shortages of imported goods as a result of extended Chinese factory shutdowns? Will Chinese factories reopen following Chinese New Year closures only to find labor shortages from workers who elect not to return? Will there be shortages of products manufactured outside of Asia because of missing Chinese-made components? Will we have a consumer-driven recession as Westerners pull back on spending after seeing their equity portfolios collapse and in light of their newfound aversion to travel? Are economies around the world so intertwined that a recession in China (whether the Chinese government admits to it or not) makes a global recession inevitable?
While the supply and production issues have been concerns for several weeks, what’s changed in the past week is that the world’s consumption centers, not just the world’s manufacturing center, are feeling ill. There could simultaneously be a shortage of goods and consumers with little interest in buying — not great for freight demand.
The SONAR chart above illustrates the latest declines in outbound 40-foot loaded container volume from the LA port complex (includes Long Beach) as well as the decline in the Freightos Baltic Daily Index from China to the U.S. West Coast. We consider those data series among the best indexes to monitor the ongoing impact of the coronavirus because they are daily (ORAIL uses a seven-day moving average) and are heavily weighted toward goods manufactured in China for U.S. consumption.
Outbound loaded container volume fell from around 3,200 per day to an average of 1,831 per day during the past seven days, and that data series hasn’t yet found a bottom. Meanwhile, the Freightos Baltic Daily Index from China to the U.S. West Coast declined from nearly $1,600 per 40-foot container to just under $1,300. We attribute the greater percentage drop in the Freightos Index since January (44% versus 19%) to the reduction in ocean shipping capacity which has provided some degree of support for rates.
The challenge is deciphering how much of the declines in those indices is related to abnormal factory shutdowns and blank sailings versus normal seasonality. Last year, same indexes fell in nearly similar manner with outbound international containers from LA falling from an average of 3,250 containers a day level to just over 2,000. Adding to the noise, early 2019 was abnormal because there was a pull-forward of imports from 2019 to 2018 to avoid tariffs that went into effect at the beginning of last year. With that background, we consider the drop in outbound 40-foot loaded container volume from LA to below last year’s Chinese New Year level to be significant, and it could presage a further drop and/or a lack of a rebound in March and April like we saw last year.
About the Chart of the Week
The FreightWaves Chart of the Week is a chart selection from SONAR that provides an interesting data point to describe the state of the freight markets. A chart is chosen from thousands of potential charts on SONAR to help participants visualize the freight market in real-time. Each week a Market Expert will post a chart, along with commentary live on the front-page. After that, the Chart of the Week will be archived on FreightWaves.com for future reference.
SONAR aggregates data from hundreds of sources, presenting the data in charts and maps and providing commentary on what freight market experts want to know about the industry in real time.
The FreightWaves data science and product teams are releasing new data sets each week and enhancing the client experience.
To request a SONAR demo click here.
