


Chart of the Week: National Outbound Tender Rejection Index – USA SONAR: OTRI.USA
National outbound tender rejection rates (OTRI), the rate at which carriers turn down requests from their customer for truckload capacity, jumped from 5.13% to 5.62% from Oct. 8 to Oct. 9 as Hurricane Milton closed in on Florida’s west coast. This was the largest single-day jump of the past two years. What are the takeaways for transportation providers and managers in the wake of the third major transportation market disruption to hit in less than a month?
Hurricanes can be the catalysts for dramatic shifts in North American transportation markets, traditionally making sourcing truckload capacity much more challenging. Shipping activity stalls for days, infrastructure like roads and warehouses are damaged, and then comes the disaster relief draw for carriers.
Hurricane Harvey in 2017 was the primary catalyst for one of the longest stretches of trucking market tightening of the past 20 years outside of COVID.
In the days leading into a hurricane, carriers avoid driving into danger — as they should. Shippers may send out increased orders as they try to move their goods out of harm’s way.

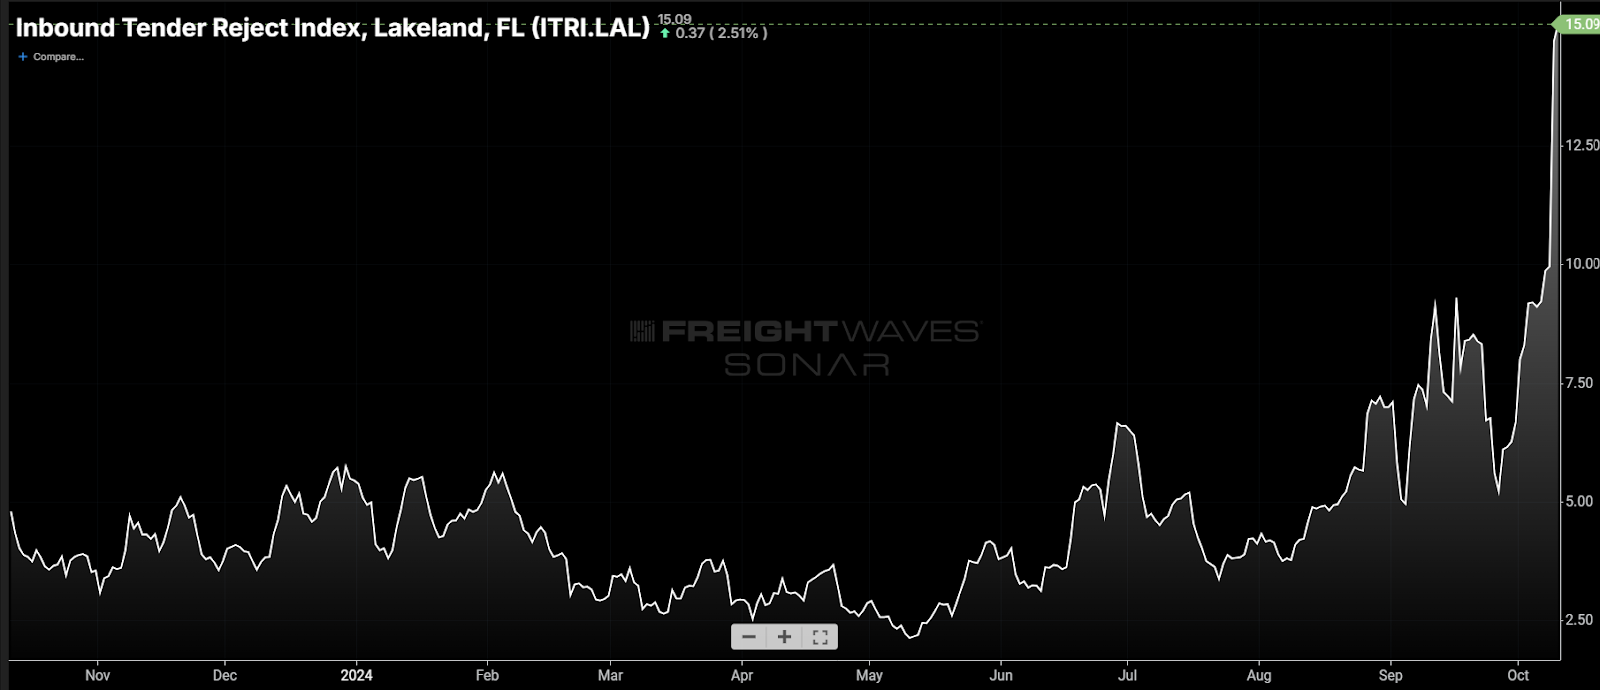
Inbound tender rejection rates for the Lakeland market in central Florida spiked to over 15%, the highest value since the pandemic era ended in early 2022.
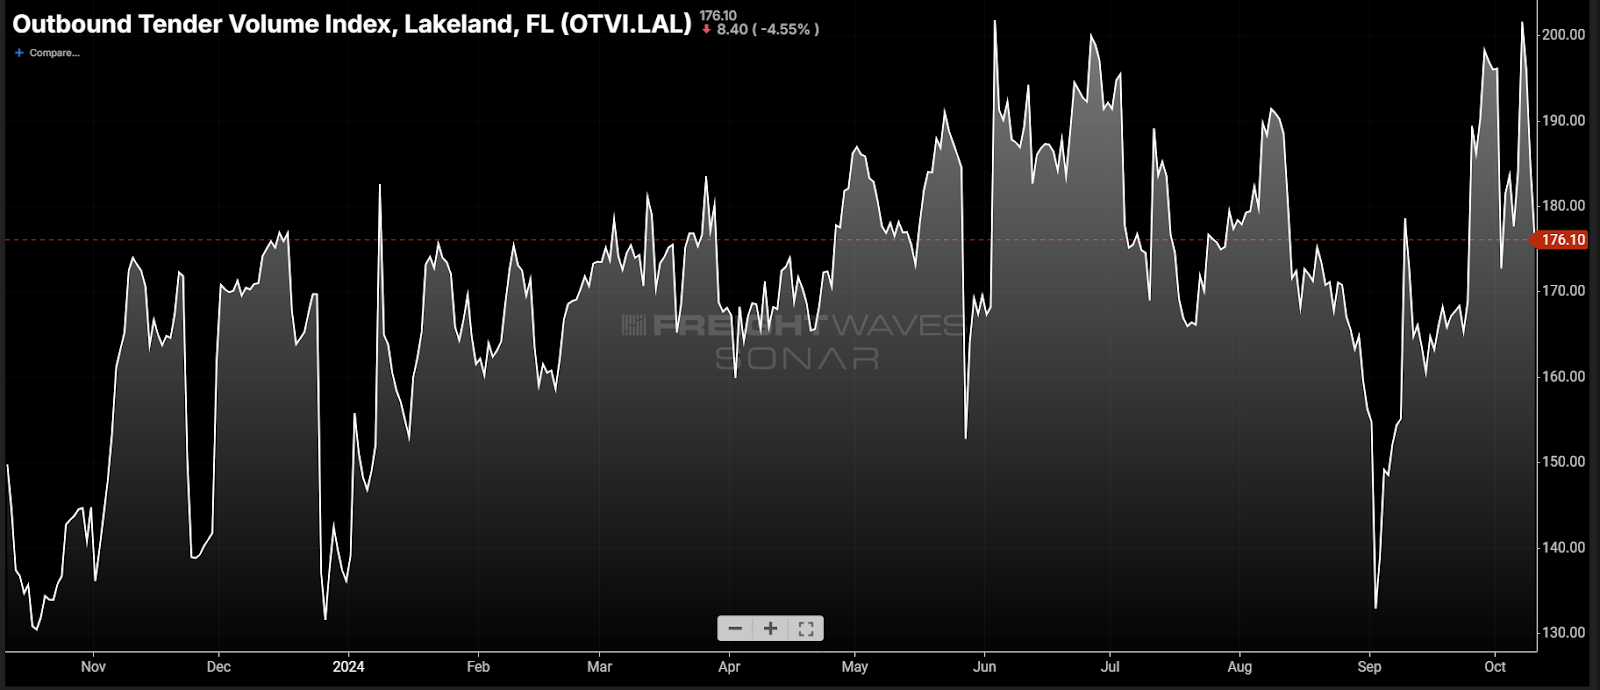
Outbound tender volumes also increased ahead of the storm, before dropping quickly as it made landfall.
This type of activity creates bottlenecks in transportation shipping for a period of time after the storm passes. The national freight market has been a well-oiled machine since early 2022, as there has been more than enough trucking capacity to fill in the gaps when disruptions have occurred.
Back to back … to back
Milton is the third major disruption to hit national transportation networks over the past three weeks. Hurricane Helene landed in the Big Bend area of the Florida Gulf Coast on Sept. 26 as a major Category 4 storm. The bulk of the damage occurred inland as the system quickly tracked into north Georgia and the western Carolinas. The storm caused catastrophic damage to the area but was not a major immediate disruption to transportation due to the lack of a major outbound shipping presence being impacted.
The following week, the International Longshoremen’s Association (ILA) went on strike for three days, resulting in several days of lost container clearing and shipping activity around the East Coast ports. While many shippers were prepared for this, some slight deterioration was detected in the form of slightly increasing rejection and spot rates.
While shippers could prepare, there was little carriers could do besides attempt to find other freight to haul. This put them out of position when the strike ended. With shippers being relatively prepared and the strike lasting only a few days, there was not a strong sense of urgency to recover.
Milton has by far been the most impactful, at least on the surface. The timing of the system hitting on the heels of two other network-altering events has potentially exacerbated its influence.
See spot sit

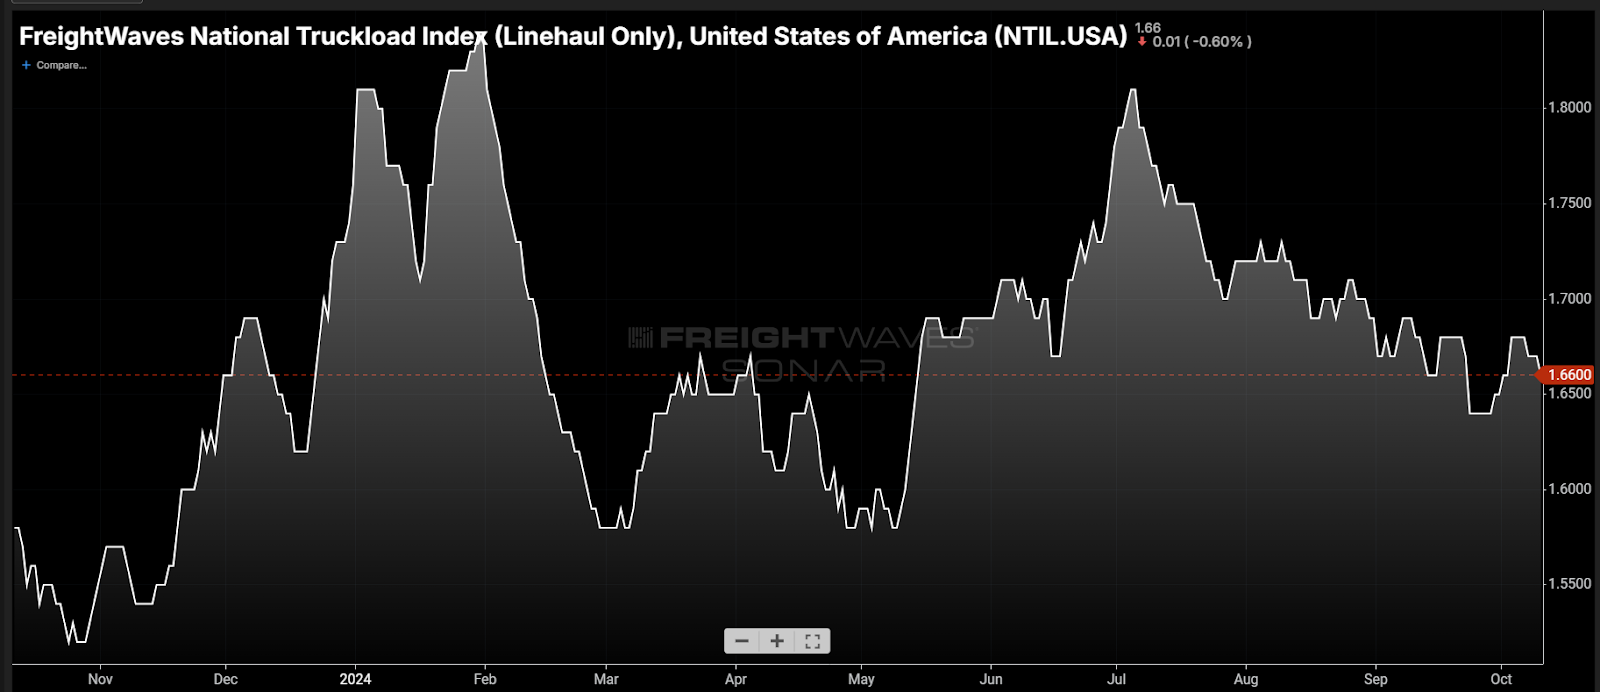
The spot market was not quick to respond to Milton. As of Thursday, there was not a large-scale shift in direction of spot rates. The National Truckload Index excluding the influence of fuel (NTIL) was trending downward as of Thursday. Spot and rejection rates normally have a strong correlation, so why are spot rates less responsive than rejections in this situation?
With carriers avoiding the area in front of the storm, there was plenty of available capacity outside the most affected region and not enough accepted freight to drive rates higher significantly on a national level out of the region. In other words, give it a minute.
As shippers get back to work in the coming week and disaster relief efforts begin in earnest, there will be an upward push on spot rates as capacity will inevitably get drawn into the region.
The Federal Emergency Management Agency will need assistance from the nation’s carriers, and yes, some of these loads will pay well above what they are getting from existing customers, forcing them to make the decision between a FEMA load and a customer load. The jury is out on the scale of this influence.


Contract rates are showing signs of bouncing off the floor in an environment that they could still be moving lower. National truckload dry van contract rates are down roughly 2% y/y but flat over the past six months and up 1% over the past quarter.
This means carriers have largely hit the threshold of where they are willing to price lower to get business in an environment where supply remains abundant. In other words, rates are low, and it will not take a lot of financial incentive to get carriers to move freight outside of their existing customer base.
The initial wave of rejections is just the reflection of physical inability to move freight. The next phase will tell us exactly how vulnerable the market is in terms of how much slack is available to swoop in and handle the recovery.
October is traditionally a slower month for trucking, making the rejection rate jump that much more significant. The transportation market appeared to still have enough resiliency to handle two major events, but the jury is still out on the third. A lot will be learned about where we are in the current oversupplied freight cycle in the coming weeks, leading into retail peak shipping season.
About the Chart of the Week
The FreightWaves Chart of the Week is a chart selection from SONAR that provides an interesting data point to describe the state of the freight markets. A chart is chosen from thousands of potential charts on SONAR to help participants visualize the freight market in real time. Each week a Market Expert will post a chart, along with commentary, live on the front page. After that, the Chart of the Week will be archived on FreightWaves.com for future reference.
SONAR aggregates data from hundreds of sources, presenting the data in charts and maps and providing commentary on what freight market experts want to know about the industry in real time.
The FreightWaves data science and product teams are releasing new datasets each week and enhancing the client experience.
To request a SONAR demo, click here.