


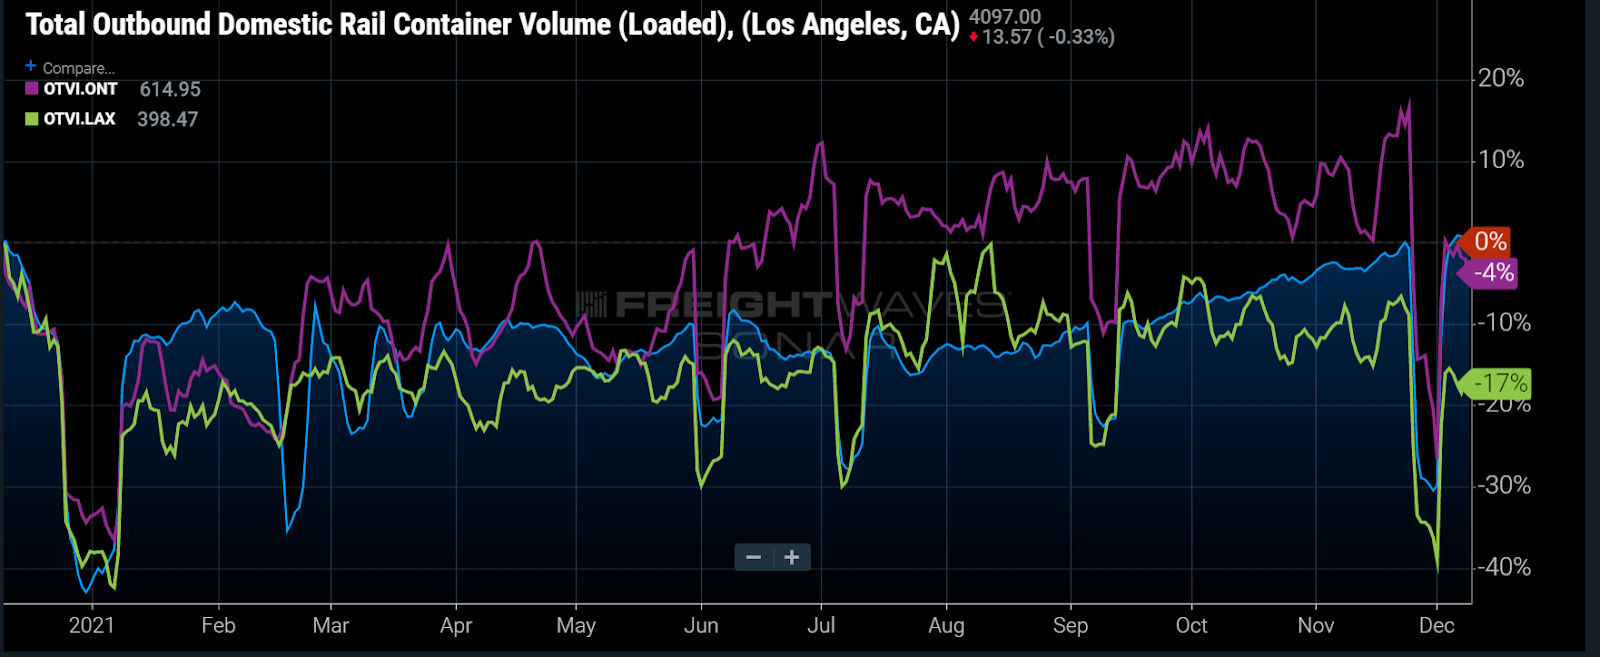
Chart of the Week: Total Outbound Domestic Rail Container Volume (Loaded) – Los Angeles, Outbound Tender Volume Index, Ontario, Los Angeles SONAR: ORAILDOML.LAX, OTVI.ONT, OTVI.LAX
Truckload tender volumes have dropped approximately 11% over the past month out of Los Angeles while loaded domestic container shipments moving on the rail have increased 3%. It is somewhat normal for freight shipments to fade coming from Southern California this time of the year, but the extreme divergence between trucking tender volumes and rail intermodal shipments is much larger than expected. The big takeaway is that shippers are relying more on the rail than they have all year out of the nation’s hottest and most expensive market.
The overwhelming amount of containerized imports from Asia has created problems so significant for companies that the U.S. government has passed bills attempting to alleviate the congestion around the ports of Los Angeles and Long Beach.

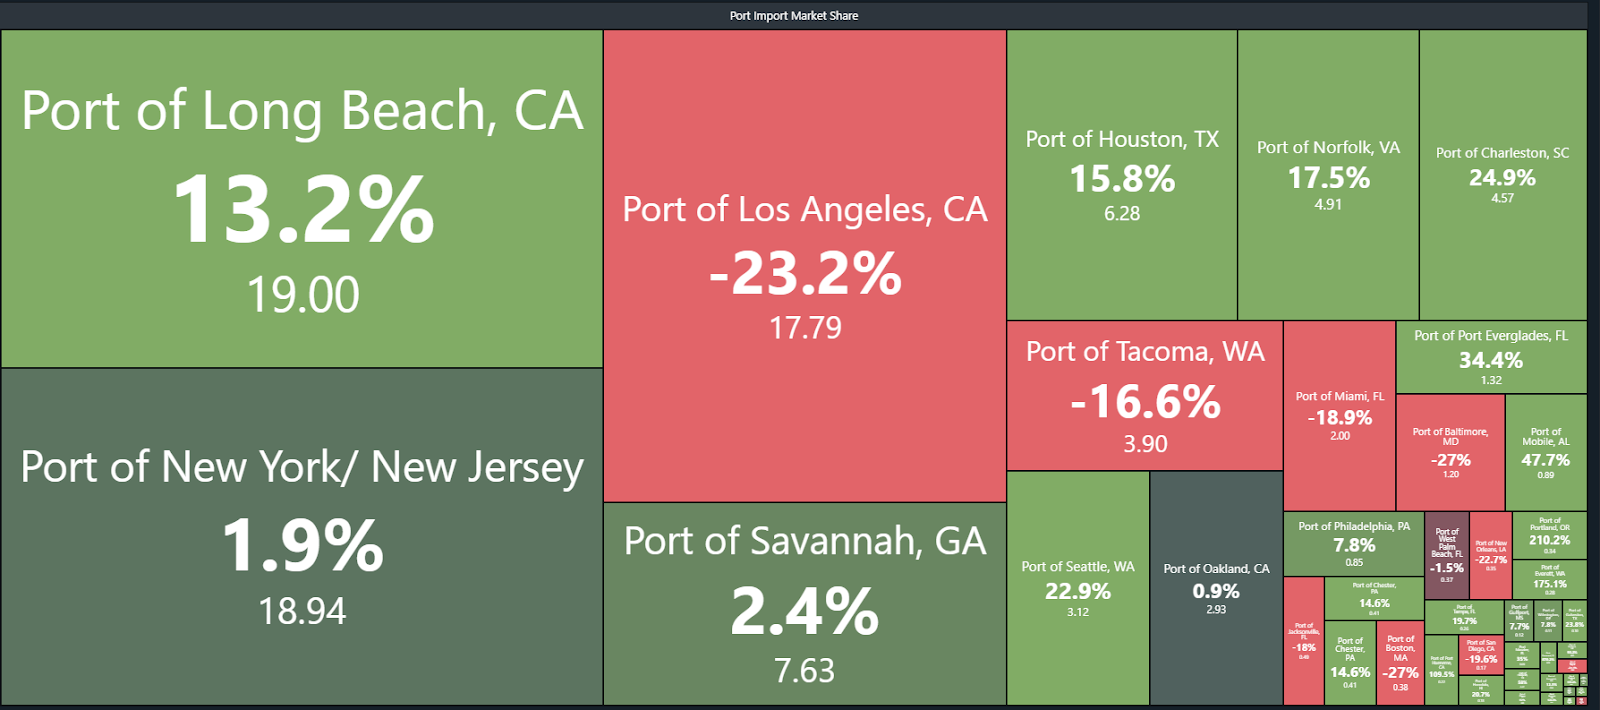
The ports of Los Angeles and Long Beach handled approximately 36% of the import shipments that cleared customs in the U.S. in November. By comparison, New York/New Jersey handled close to 19%, with Savannah coming in third at 7.6%.
The LA ports have lost some ground versus last year, when they handled close to 40% of the total maritime import shipments. Shippers have attempted to find other ways into the U.S. to bypass the congestion and carriers have encouraged this to some extent with pricing.
Even though the nation’s infrastructure is designed to handle most of its import volumes through the Southern California ports, there has never been this amount of volume. Subsequently, the surface transportation providers have also struggled to keep pace.
During the summer, Union Pacific stopped service to Chicago due to heavy container congestion around its terminal. A lack of drayage capacity was cited as the main cause. Deteriorating service also contributed to many shippers deciding to move their freight via truck.
Looking at loaded rail container data, there has been a strong revival in domestic intermodal container volumes over the past few months, indicating that shippers are finding it easier to move more freight via rail.

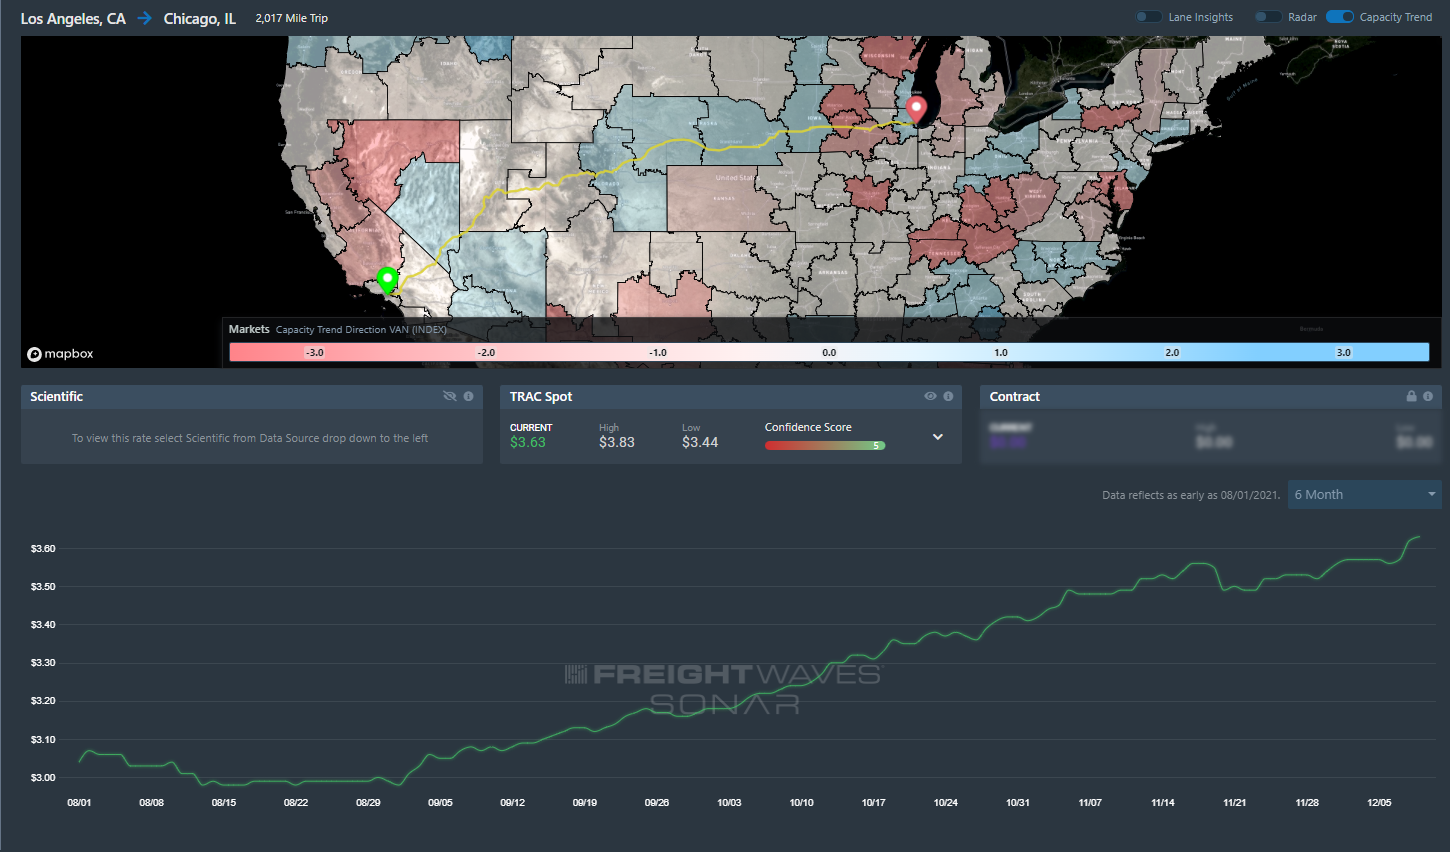
Spot rates have continued to rise from Los Angeles to Chicago even as contracted demand has fallen, hitting $3.63 per mile including fuel, according to FreightWaves TRAC rates. Rejection rates have not fallen proportionately to demand either, meaning less demand is not improving capacity or rate conditions — at least yet.

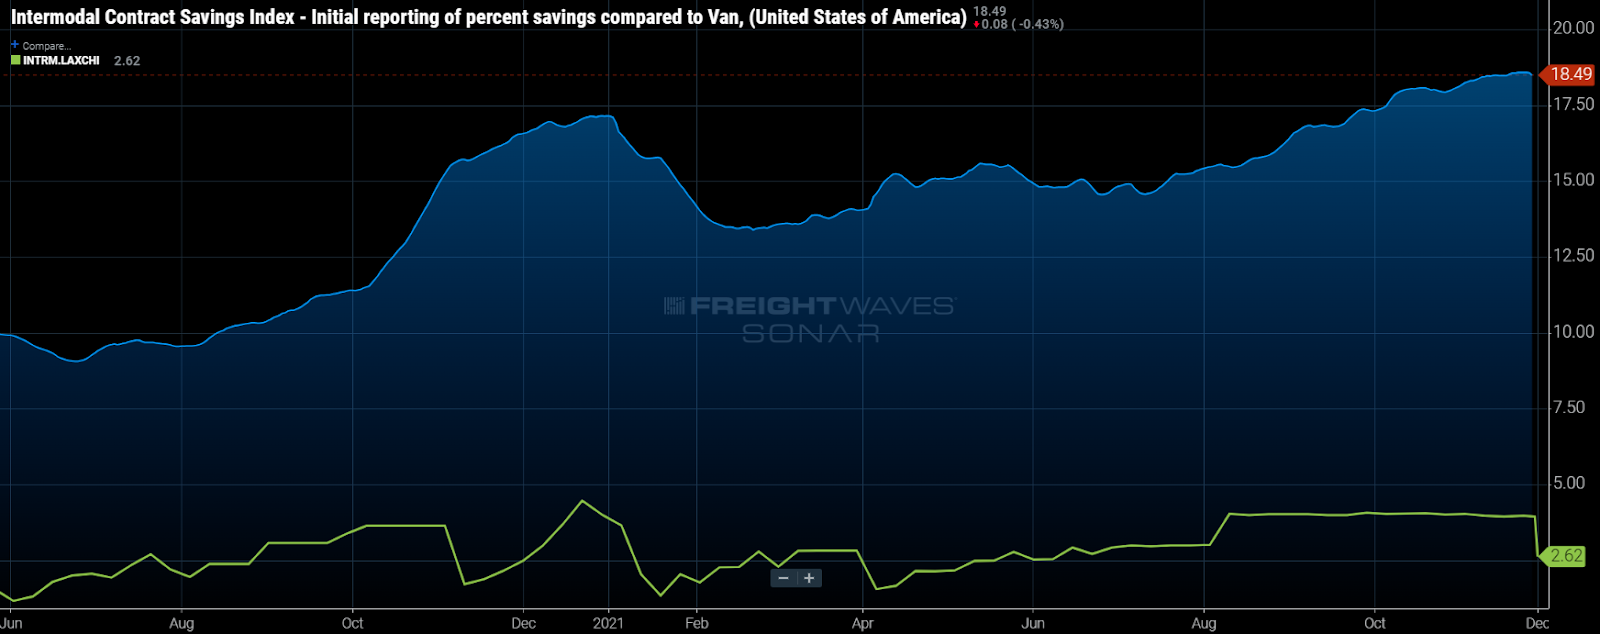
Intermodal contract rates are currently showing over an 18% savings when compared to dry van. Spot rates from Los Angeles to Chicago for intermodal shipments also just recently dropped back below $3 per mile including fuel after hovering around $4 since the beginning of August.
The price differential may be enough to pull shippers back onto the rails, especially if there is less urgency around the freight moving now.
About the Chart of the Week
The FreightWaves Chart of the Week is a chart selection from SONAR that provides an interesting data point to describe the state of the freight markets. A chart is chosen from thousands of potential charts on SONAR to help participants visualize the freight market in real time. Each week a Market Expert will post a chart, along with commentary, live on the front page. After that, the Chart of the Week will be archived on FreightWaves.com for future reference.
SONAR aggregates data from hundreds of sources, presenting the data in charts and maps and providing commentary on what freight market experts want to know about the industry in real time.
The FreightWaves data science and product teams are releasing new data sets each week and enhancing the client experience.
To request a SONAR demo, click here.