The highlights from Thursday’s SONAR reports are below. For more information on SONAR — the fastest freight-forecasting platform in the industry — or to request a demo, click here. Also, be sure to check out the latest SONAR update, TRAC — the freshest spot rate data in the industry.
Market watch
Elizabeth, New Jersey
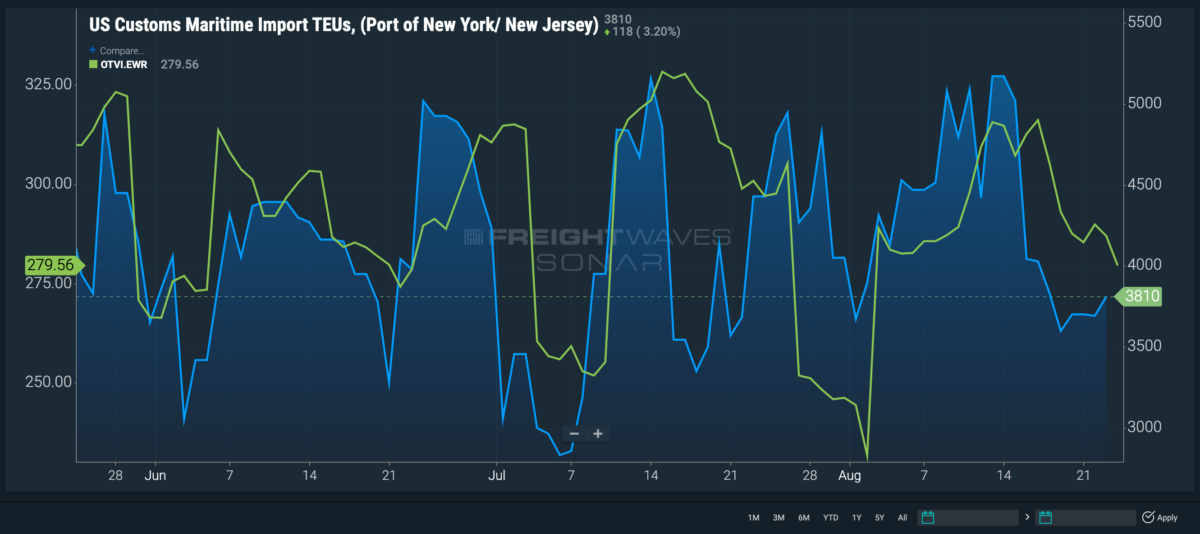
The Outbound Tender Volume Index in Elizabeth is down for the eighth day in a row, falling 10.5 basis points, or 4.1%, since the start of the slump. Containerized imports at the Port of New York and New Jersey are ticking up after a steep drop. In the last six days, maritime imported twenty-foot equivalent units are up 5.9%.
When comparing inbound container volume with outbound truckload volume, it is clear that the two follow a similar pattern, and the increase in imports is expected to hit the truckload market over the next week.

Capacity is already tightening, as Elizabeth’s Outbound Tender Reject Index is up 130 bps, or 25.1%, in the past 10 days. The decrease in volume but rise in rejections is an indication that more truckload volumes might be hitting the spot market to take advantage of lower rates.
St Louis
Outbound tender volumes in St. Louis are climbing steadily this month. Since Aug. 2, the Outbound Tender Volume Index is up 16 bps, or 20.3%.
St. Louis is traditionally a headhaul market, but in 2022 we’ve seen markets going against the grain, and St. Louis is one of them. Since June, inbound volumes have remained higher than outbound volume levels, causing the Headhaul Index to dip into minus territory. As of Thursday, inbound loads exceed outbound by 20.1%. Although this recent increase in outbound volumes is pushing St. Louis’ Headhaul Index up 16.5 points, or 44.8%, since the end of July to minus-18.5.
The recent rise in inbound freight is loosening capacity even further. The Outbound Tender Reject Index slipped 94 bps to 5.8%, hinting that carriers are turning to their contracted freight for better rates.
NTI as a point of reference
The National Truckload Index is a daily look at how spot rates in specific lanes hold up in comparison to the national average, giving carriers and brokers an idea of which lanes to gravitate toward or avoid.
Lane to watch: Cincinnati to St. Louis
The Outbound Tender Volume Index in Cincinnati is up more than 13 points, or 12.7%, since last week. Spot market rates from Cincy to St. Louis have been consistent in the past three months at or around $3.48 a mile — 78 cents above the national average. Not a bad place to land, as the Headhaul Index is up 65% in Cincy over the past week.
