


This week’s FreightWaves Supply Chain Pricing Power Index: 35 (Shippers)
Last week’s FreightWaves Supply Chain Pricing Power Index: 35 (Shippers)
Three-month FreightWaves Supply Chain Pricing Power Index Outlook: 40 (Shippers)
The FreightWaves Supply Chain Pricing Power Index uses the analytics and data in FreightWaves SONAR to analyze the market and estimate the negotiating power for rates between shippers and carriers.
This week’s Pricing Power Index is based on the following indicators:
Tender volumes down week over week, but stabilizing
Truckload volumes have retreated from the post-Labor Day peak, but the positive sign for the market is that demand levels remain elevated compared to where they were in the back half of July and all of August. With import levels at or near record highs, the freight market is setting up for a stronger fourth quarter than a year ago from a volume perspective.

To learn more about FreightWaves SONAR, click here.
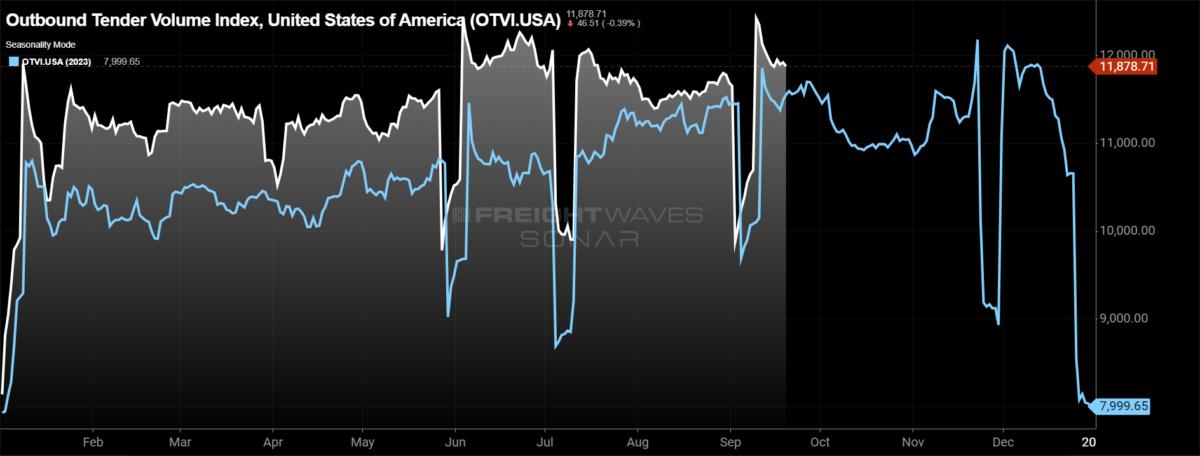
The Outbound Tender Volume Index (OTVI), a measure of national freight demand that tracks shippers’ requests for trucking capacity, is down 1.46% week over week as volumes retreated from a recent peak but have started to level out the past couple of days. The OTVI is now up 2.53% compared to this time last month and 2.74% year over year, highlighting recent and longer-term growth in the market.
To learn more about FreightWaves SONAR, click here.
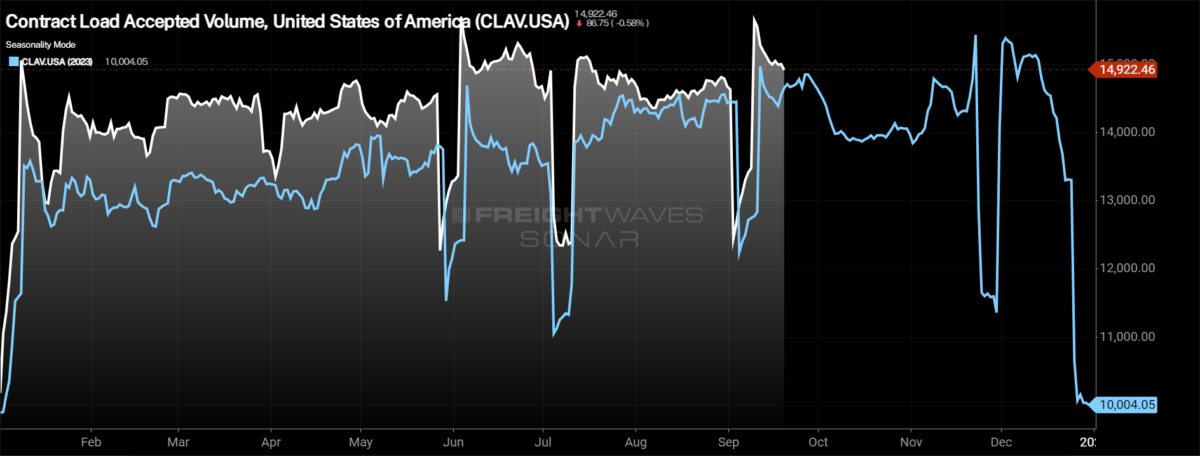
Contract Load Accepted Volume (CLAV) is an index that measures accepted load volumes moving under contracted agreements. In short, it is similar to OTVI but without the rejected tenders. Looking at accepted tender volumes, we see a decrease of 1.83% w/w. The larger decrease in accepted tenders than overall tenders is due to the slight uptick in the tender rejection rate over the past week.
Last Tuesday’s release of retail sales data showed that despite a strong July that tempered expectations for August, consumers were still more than willing to spend. Economists were expecting retail sales to fall during August, but instead they increased by 0.1% month over month. Nonstore retail sales and miscellaneous retail store sales were the two categories that saw the biggest monthly increase in sales, rising 1.4% m/m and 1.7% m/m, respectively.
Bank of America’s recent credit and debit card spending report shows that spending is still higher than it was a year ago. In the most recent report, for the week ending Sept. 14, total card spending on a per-household basis was 1.4% higher than this time last year. Online sales were up 3.2% y/y, and general merchandise spending was up 4.7% y/y, according to the latest report.

To learn more about FreightWaves SONAR, click here.
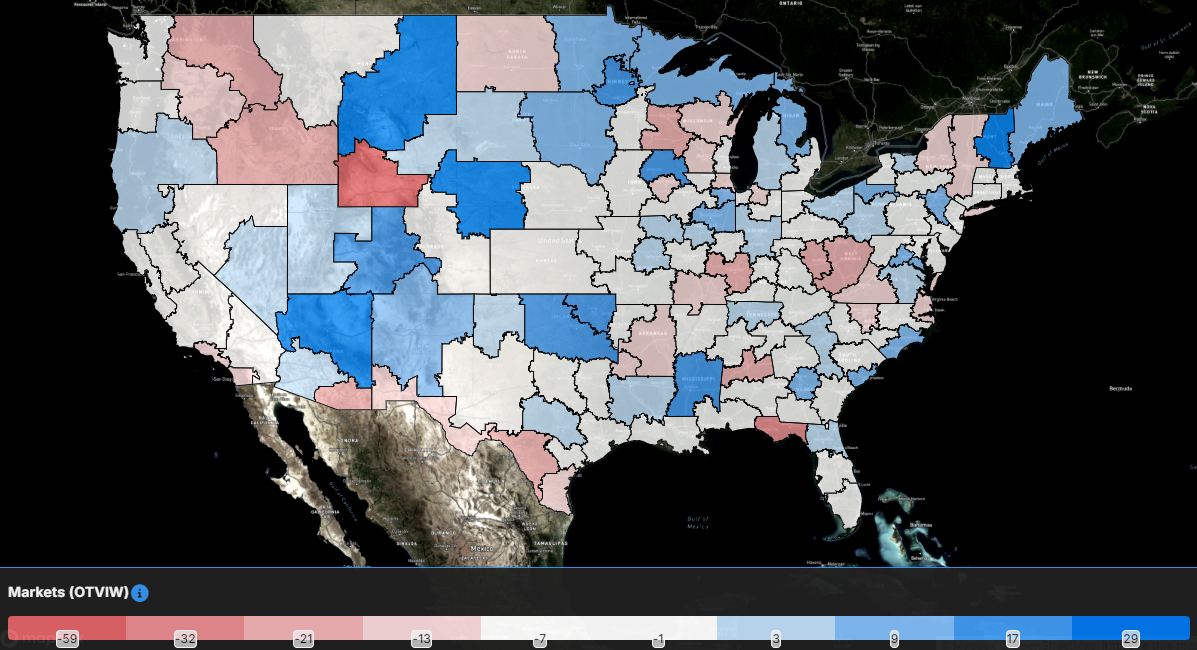
As expected with an over 1% drop in tender volumes at the national level, the majority of the freight markets experienced lower volumes over the past week. Of the 135 freight markets tracked within FreightWaves SONAR, 59 experienced higher volumes compared to last week.
Much of the tender volume growth week over week was isolated to smaller freight markets like Billings, Montana, and Flagstaff, Arizona, where volumes were up over 30% week over week.
The largest markets in the country were under pressure this week. In Atlanta, tender volumes dropped by 3.64% w/w. In the largest market in the country, Ontario, California, the decline was even more severe: Tender volumes fell by 4.84%.
To learn more about FreightWaves SONAR, click here.
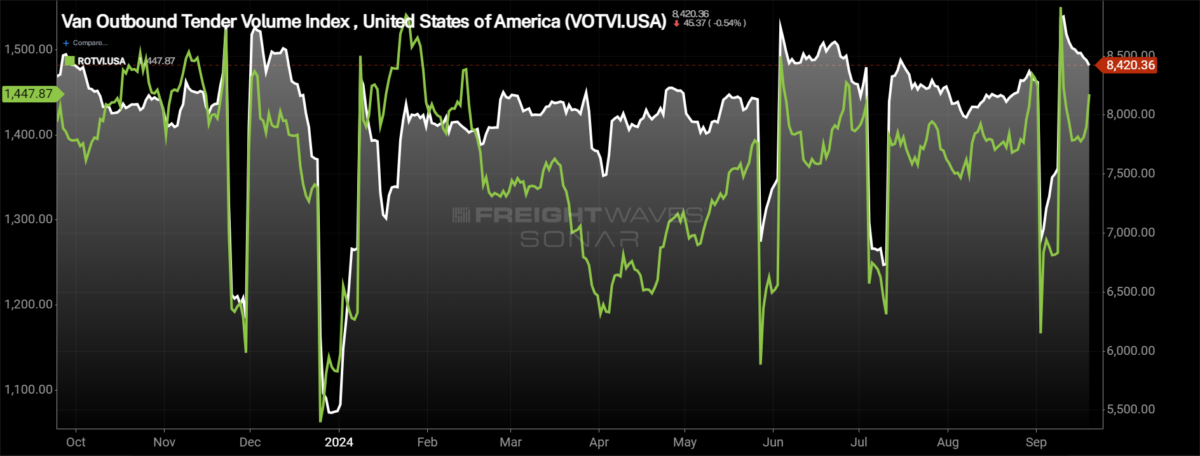
By mode: While the overall market has stabilized for the time being, the dry van market continues to see volume levels retreat from recent highs. The Dry Van Outbound Tender Volume Index has fallen by 2.26% over the past week and is just 1.5% above year-ago levels.
The reefer market, on the other hand, is experiencing a sizable uptick in volumes just a little over halfway through September. The Reefer Outbound Tender Volume Index increased by 2.41% over the past week and turned positive on a y/y basis for the first time in over a month, now up 1.18%.
Rejection rates break away from last year’s trend
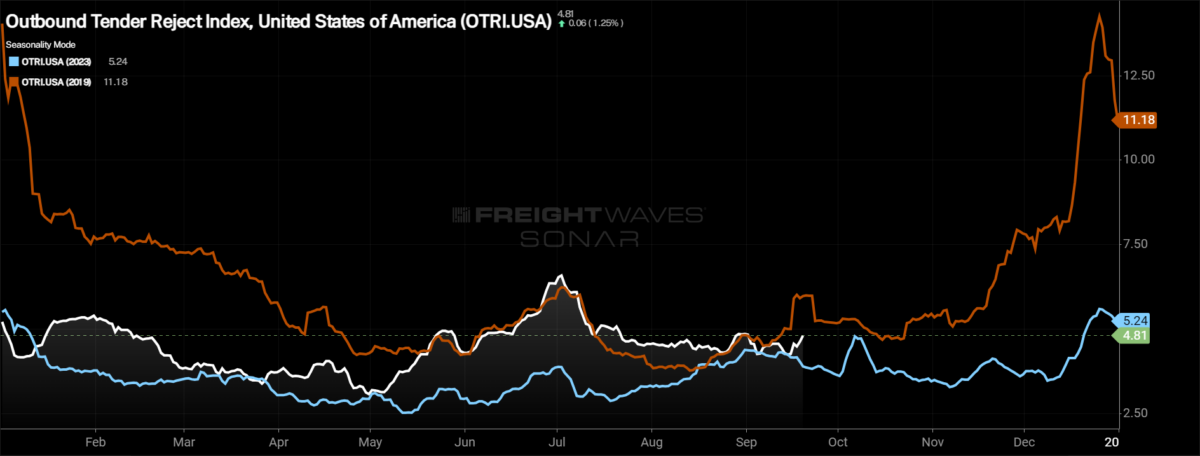
After an uneventful Labor Day holiday, capacity in the freight market continues to be readily available. Now, over the past week, rejection rates have moved slightly higher, breaking away from the trend established last year when rejection rates moved lower through September. The International Longshoremen’s Association’s potential strike is set to get started in just over a week, so the impacts will likely appear throughout the week, which could expose risks to capacity across the country.
To learn more about FreightWaves SONAR, click here.
Over the past week, the Outbound Tender Reject Index (OTRI), a measure of relative capacity, increased by 36 basis points to 4.81%, approaching the highs around Labor Day. The OTRI is now 91 basis points above last year’s levels, a signal that while it doesn’t feel tighter because rejection rates are still below 5%, rejection rates are moving higher in aggregate.

To learn more about FreightWaves SONAR, click here.
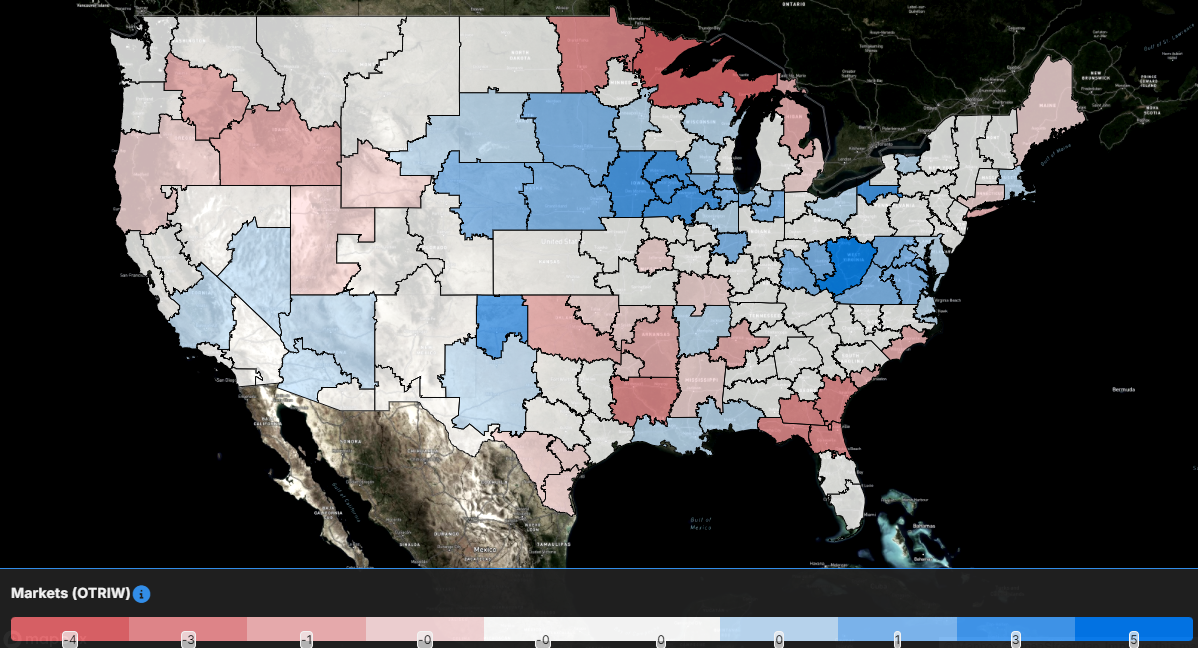
The map above shows the Outbound Tender Reject Index — Weekly Change for the 135 markets across the country. Markets shaded in blue are those where tender rejection rates have increased over the past week, whereas those in red have seen rejection rates decline. The bolder the color, the more significant the change.
Of the 135 markets, 92 reported higher rejection rates over the past week, an increase from 74 in last week’s report.
The largest increases in the country continue to be across the Midwest, in smaller freight markets like Dubuque and Des Moines, Iowa, where rejection rates increased by 405 bps and 384 bps over the past week, respectively.
Arguably the most significant changes to rejection rates in the country are around the Chicago metro area. Rejection rates in Chicago and neighboring market Joliet, Illinois, increased over the past week by 164 bps and 168 bps, respectively. It marks the first time that both markets have exceeded the national tender rejection rate.
To learn more about FreightWaves SONAR, click here.
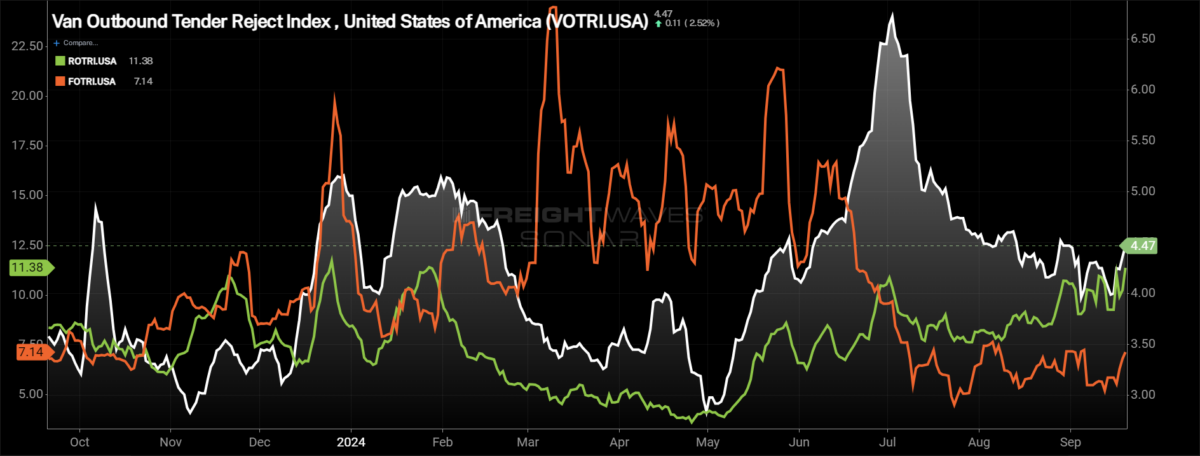
By mode: Across all modes, tender rejection rates moved higher over the past week. The dry van market has seen rejection rates reach the highest level of September, surpassing Labor Day weekend levels. The Van Outbound Tender Reject Index increased by 32 basis points over the past week to 4.47%.
The reefer market continues to see rejection rates trend higher, but not without intermittent volatility. The Reefer Outbound Tender Reject Index increased by 83 basis points over the past week to 11.38%, the highest level rejection rates have been since late January.
Those with exposure to the industrial side of the economy likely breathed a collective sigh of relief this week. The Federal Open Market Committee opted to slash the target range of the federal funds rate by 50 basis points and expects another 50 basis points to be cut by the end of the year, but it is unknown if that will be a single cut or two. The cut to interest rates won’t immediately be impactful, but it creates an environment where 2025 will be better than 2024, especially if more cuts come in 2025. Even so, the Flatbed Outbound Tender Reject Index increased by 194 basis points over the past week to 7.14%.
Spot rates move ever so slightly higher
As tender rejection rates moved ever so slightly higher this week, spot rates stopped their decline, flattening out around levels experienced during International Roadcheck. The potential for disruptions around the ILA strike could create some short-term momentum, but that remains to be seen as frankly there is still too much capacity in the market.
To learn more about FreightWaves SONAR, click here.
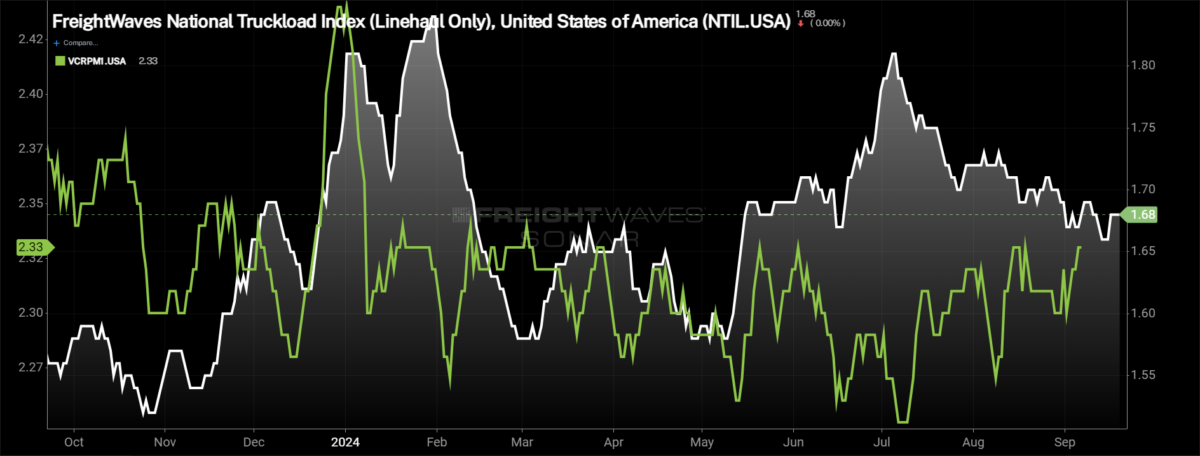
This week, the National Truckload Index — which includes fuel surcharge and various accessorials — erased last week’s decline, rising by 1 cent per mile from the week prior at $2.25 per mile. The NTI is now 3 cents per mile or 1.3% lower than it was this time last year. The linehaul variant of the NTI (NTIL) — which excludes fuel surcharges and other accessorials — matched the NTI’s increase, rising 1 cent per mile this week to $1.68. The NTIL is 10 cents per mile higher than it was at this time last year. The discrepancy in the NTIL and NTI is solely the changes in fuel, which was far more expensive in 2023 than currently. The average diesel truck spot price per gallon is 97 cents, or 21.1%, lower than it was last year.
Initially reported dry van contract rates remain in a fairly tight range, rising by 3 cents per mile over the past week to $2.33. Throughout 2024, contract rates have been in a tight range, an indication that the extreme cost savings are in the rearview mirror and service is now coming to the forefront. Initially reported contract rates are down 4 cents per mile from this time last year, a 1.7% decline.
To learn more about FreightWaves SONAR, click here.
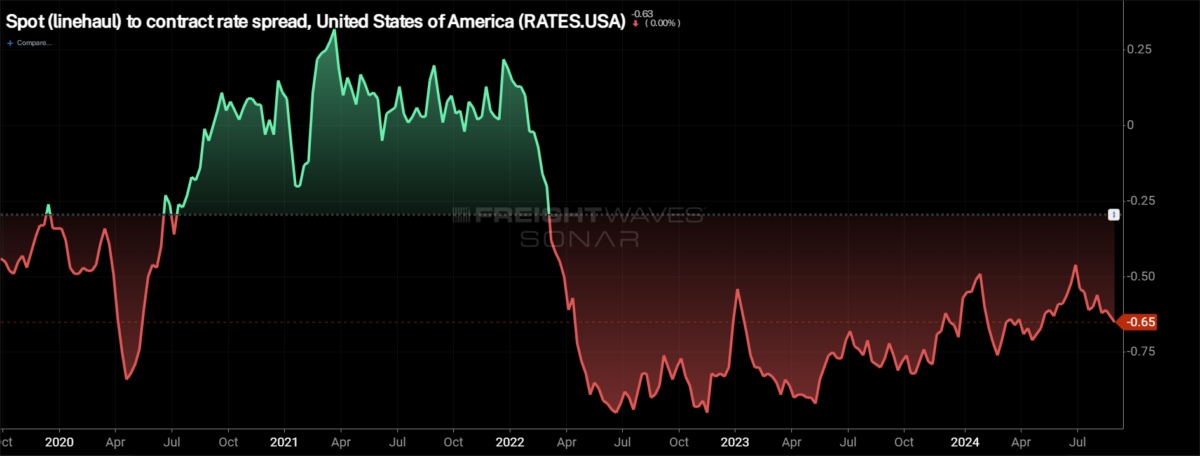
The chart above shows the spread between the NTIL and dry van contract rates is trending back to pre-pandemic levels. The spread remains historically wide and has actually widened in recent weeks, diverting from the pre-pandemic average that it had been inching closer to throughout the year. Significant disruptions can quickly tighten the spread as spot rates react much faster, so seeing a narrowing of the spread in the fourth quarter, during truckload peak season, wouldn’t be a surprise. The question is how significant the narrowing is and whether it is sustainable, especially if the first quarter of 2025 is the traditionally soft period for freight demand.

To learn more about FreightWaves TRAC, click here.
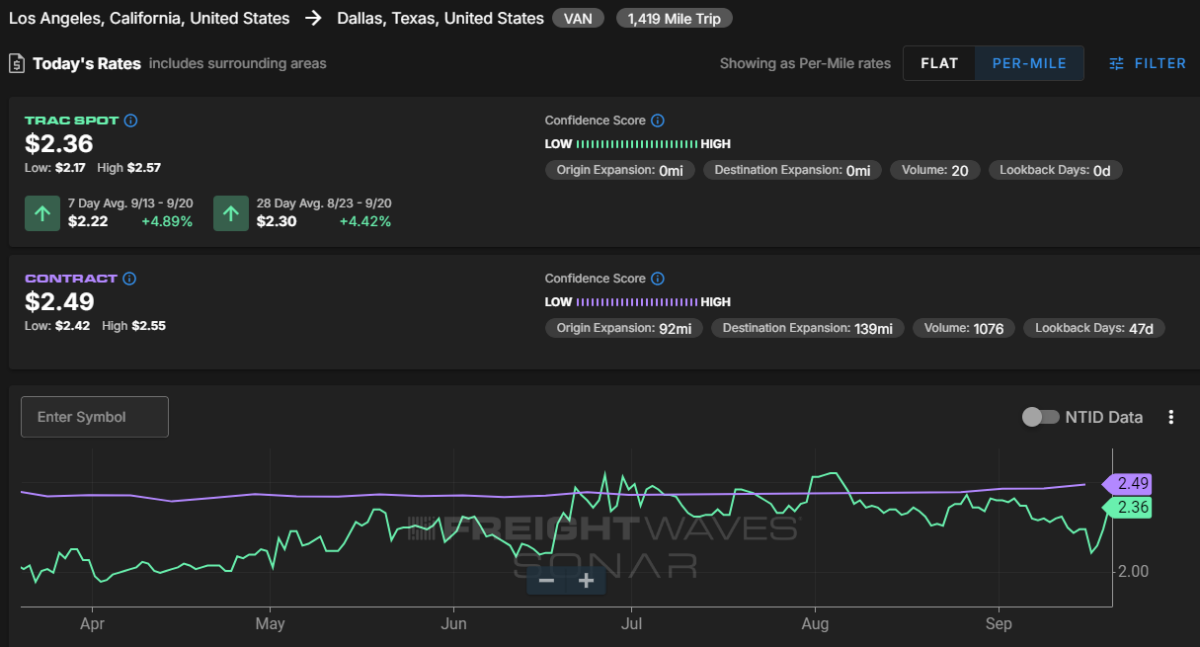
The FreightWaves Trusted Rate Assessment Consortium spot rate from Los Angeles to Dallas erased all of last week’s decline and then some. The TRAC rate from Los Angeles to Dallas increased by 8 cents per mile to $2.36. Spot rates along this lane are now just 13 cents per mile below the contract rate.

To learn more about FreightWaves TRAC, click here.
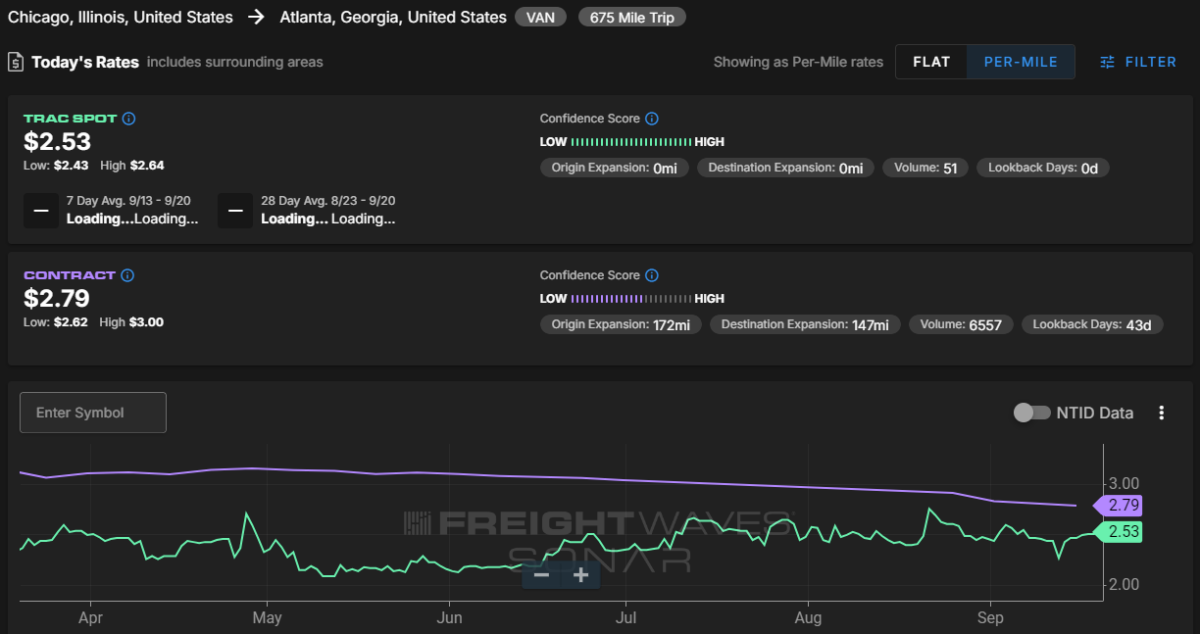
From Chicago to Atlanta, spot rates recovered to levels that are more in line with where they have been for the past two months, indicating that last week was more of an anomaly than the overarching trend. The FreightWaves TRAC spot rate along this lane rose by 26 cents per mile to $2.53, just 26 cents per mile below the contract rate.