The U.S. truckload market is still soft, with accepted contract shipments running approximately 5.5% lower than the year-ago period, and loose, as only 5.5% of contract truckload tenders are being rejected by carriers.
When market conditions are favorable to carriers, they reject more contracted freight and deploy their assets in the spot market, striving to maximize yield or revenue per loaded mile. When market conditions are unfavorable, carriers tend to reject fewer shipments and take what they’re offered, optimizing for asset utilization.
“Capacity is available,” commented a business analyst at a large national freight brokerage Wednesday morning. “Loads are moving. There’s some buzz around the potential [rail] strike, but only among certain shippers.”
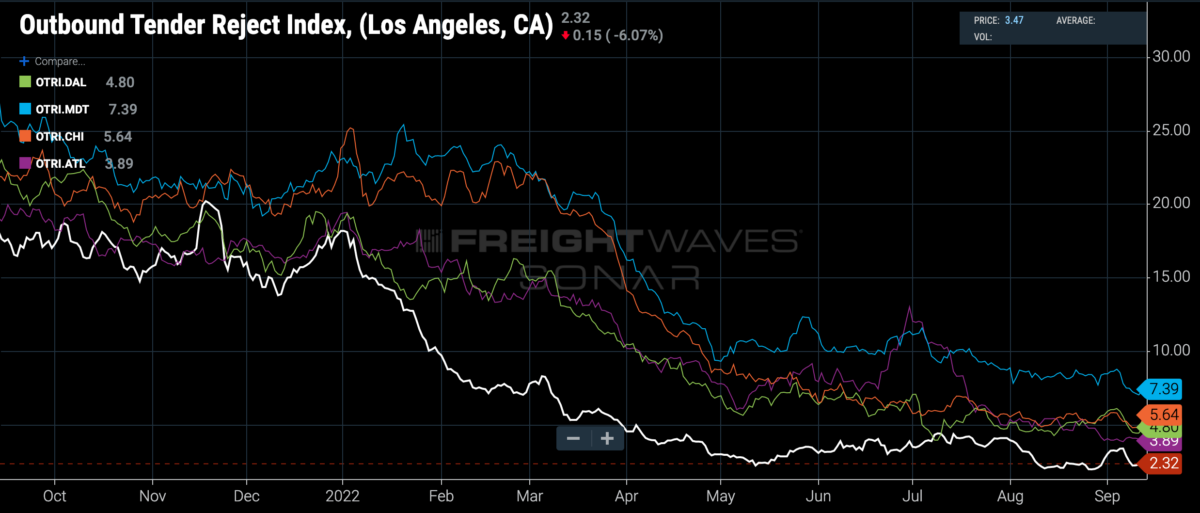
Trucking capacity is loose across the country. The chart below displays tender rejection rates for the five largest markets in the country: Los Angeles is the loosest, only rejecting 2.32% of its outbound loads, while Harrisburg, Pennsylvania, is the tightest of the big five, rejecting 7.39% of shipments, a far cry from the more than 20% rejected out of that market back in March.

Commenting on loose market conditions, a freight broker told FreightWaves Wednesday morning that “everything is still pretty easy, and outbound Georgia is really easy — there’s no freight coming out of Georgia. And we haven’t had any issues moving freight out of Los Angeles.”
In a Tuesday client note, Susquehanna equities analyst Bascome Majors noted that “domestic truckload rates (including fuel) are trending subseasonally for the eighth consecutive week, marking the longest subseasonal streak in our [eight-plus] years of historical data.”
The profound weakness in the truckload spot market — even diesel prices have been falling steadily since July — has already shown up in shippers’ increased willingness to ask for contract rate reductions. Earlier in the spring, some shippers hesitated to aggressively reprice their freight due to uncertainty about the state of the truckload cycle. Unpredictable demand surges related to lockdowns and fiscal stimulus had left them without enough capacity in 2021, and they didn’t want to drop the rates on their routing guides only to have the market heat up again.
But many shippers have now lowered their contract rates, and indeed the freight is moving at those substantially lower rates and showing up in SONAR data. Two weeks ago, freight brokers told FreightWaves that it “feels like a typical race to the bottom,” and now we have the quantitative data.
The chart below displays the initial report of contract truckload transactions in SONAR’s freight payments data set and clearly illustrates a steep drop from mid-July to mid-August of approximately 5.8%. That’s a relatively fast decline for contract rates, and they may step down again before peak season.
On the rails, intermodal volumes have actually been steadily improving, despite congestion and issues with staffing and capacity. After trending negative on a year-over-year (y/y) basis for the majority of 2022, intermodal volumes recently crossed into positive territory. Year to date, the best-performing rail commodities have been those closely linked to food and energy — grain volumes have soared, as well as coal, frac sand and chemicals.
Looking farther upstream, trans-Pacific ocean container rates have continued their rapid descent. On Wednesday, the Freightos Baltic Index Daily – China to North America West Coast spot rate stands at $3,973.14 per forty-foot equivalent unit, down a whopping 31% month over month (m/m). The Drewry World Container Index Shanghai to Los Angeles spot rate is now at $4,782 per FEU, down 30% m/m.
Given rapidly falling European consumer demand amid the economic stresses of an energy crisis, steamship lines will have a tough time adjusting capacity to avoid further deterioration in load factors, utilization and ultimately rate. With the trans-Pacific and northern Europe trades both experiencing pronounced softness, there are fewer remaining lanes that can productively deploy the extra capacity from large vessels.
FreightWaves has warned about impending and severe drops in container flow since June. Now it’s here. Ocean container booking data for shipments inbound to the U.S. in FreightWaves’ Container Atlas show continued declines. The chart below captures container bookings from all ports globally to all U.S. ports. (Note that lead times are approximately eight to 12 days, depending on origin, so these bookings can be up to a week and a half ahead of sailing.)
Booking demand for space on container vessels has fallen right in line with ocean container spot prices, as the Ocean Booking Volume Index for all global ports to all U.S. ports has dropped 28.8% m/m. Remember that these bookings take place in advance of sailing and that the implied volatility may or may not eventually be smoothed by queues and congestion at the ports of discharge.
Rounding out the macro picture, persistently high inflation in the United States does not bode well for freight volumes. The August CPI number came in at plus 8.3% y/y and plus 6.3% excluding food and energy, implying broad-based upward price pressure on a whole swath of goods. Consumers can and have shifted their buying down market to stretch their dollars — for instance, buying private label instead of name brand groceries — but higher costs outrunning wage gains cannot have anything but a deleterious effect on freight volumes, everything else being equal.
The higher-than-expected inflation number makes a sharp hawkish reaction from the Federal Reserve more likely, and it means that the Fed is that much more likely to overcorrect and send the economy into a recession rather than a soft landing. If unemployment starts creeping up, then freight markets, both domestic and international, will face renewed downward pressure.
