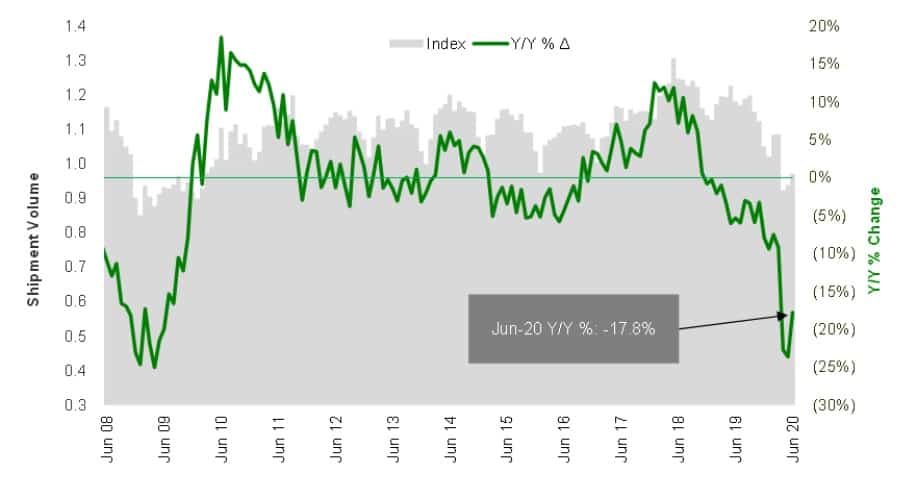
The Cass Freight Index recorded sequential improvement from May to June, but the year-over-year declines remain large.
The June shipments component of the index was up 3.5% from May with freight expenditures improving 6.4%. However, the year-over-year declines for shipments (-17.8%) and expenditures (-18.3%) keep the indexes below pre-pandemic levels.

“We were thinking the June rebound would have been stronger, based on what we’re hearing on the trucking side and what we’ve been seeing with respect to rail traffic and with the ISM Index now back above 50,” said the report’s author, Stifel Financial (NYSE: SF) equity research analyst David Ross.
Cass’ shipments data ‘lagging’ other datasets
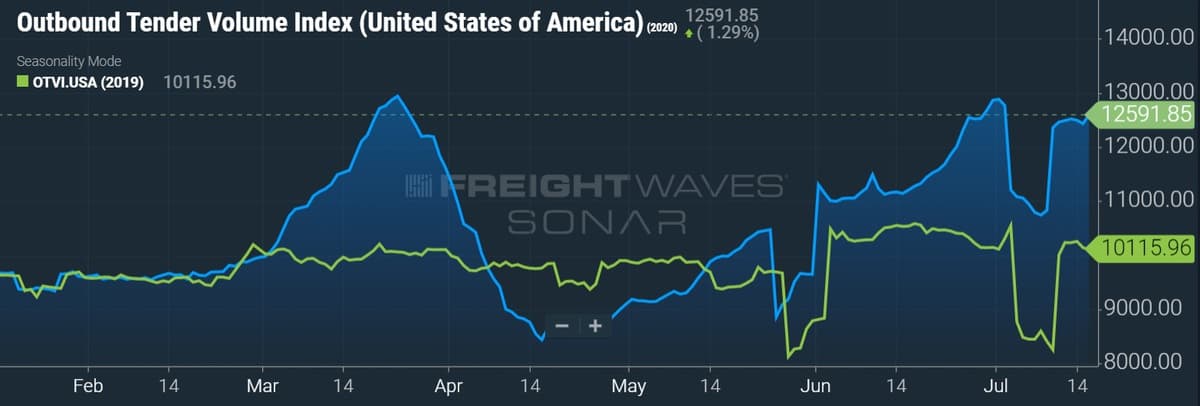
The Cass shipments data for June is worse than FreightWaves data as well as what has been reported by the publicly traded carriers.
FreightWaves’ Outbound Tender Volume Index, a measure of tendered volumes on a given day, showed year-over-year outperformance for the entire month of June. The gap appears to be widening since the July 4 holiday as the index is currently 24% higher year-over-year.

Truckload (TL) carrier Heartland Express (NASDAQ: HTLD) was first to report second quarter earnings with revenue growth of 13.2% year-over-year, up 18.4% excluding fuel surcharge revenue. The carrier doesn’t provide metrics like loads or loaded miles, but commentary from management in the company’s press release noted that weak freight demand in April, improved as the quarter progressed. The carrier reported that the trend continued into the first two weeks of July.
Temperature-controlled carrier Marten Transport (NASDAQ: MRTN) reported a 1.9% year-over-year decline in TL revenue in the second quarter. Excluding fuel, TL revenue was up 3.3%. The carrier saw loaded miles increase 9.9% year-over-year, which was primarily the combination of a 4.5% increase in average tractors and a 4.7% increase in length of haul. Empty miles declined 20 basis points to 10.9% in the quarter.
J.B. Hunt Transport Services (NASDAQ: JBHT) reported a 1.5% year-over-year decline in intermodal loads, well ahead of the rest of the industry given its previous market share gains. Loads were down 6% in April, down 4% in May and up 5% in June. The Class I railroads reported total intermodal traffic down 12.6% year-over-year in the quarter. Dedicated loads increased 6.7% as the company increased truck count by only 2.8% with the truck division seeing a 17.4% increase in loads on a flattish tractor count.
All commentary and reported metrics from the carriers are well ahead of the near 18% decline recorded in Cass’ shipments index for the month of June. Further, most have indicated that the month was the strongest of the quarter by a wide margin.
The Cass shipments index measures North American freight shipments and includes all modes of transportation. The index is trucking-centric, approximately 50% TL and 25% less-than-truckload (LTL). The data also has a little noise in that it represents the month freight invoices are processed, which could differ from the month the actual shipment occurred.
Ross suggests the Cass data has been “lagging” other datasets, not seeing the large “bounces” seen in other data. He said the Cass shipments data tends to trend inline with rail carloads, which have continued to improve to the midpoint of July. He surmised, the comparisons are “getting better still, so we’d expect Cass to rise again next month.”
Linehaul index appears to be locked in
The linehaul index, which excludes fuel and accessorial charges, dipped 0.7% from May to June and was down 5.2% year-over-year. The index is comprised largely of contract rates and has a high correlation with the yield metrics reported by publicly traded TL carriers. Ross believes that this will result in a year-over-year yield decline of approximately 6% for the public carriers during the second quarter.
J.B. Hunt reported a 7% year-over-year decline in revenue per loaded mile excluding fuel surcharges, with Marten reporting a 6% decline in the same metric. J.B. Hunt said contractual rates were down approximately 5% during the second quarter.
Ross believes that a “stronger pricing picture” is developing for the index as dry van spot rates are currently up 9.8% year-over-year inclusive of fuel surcharges. He believes these rates would be “much higher” if diesel prices weren’t depressed. “We believe the spot market (as well as the contract market) has bottomed and that the rebound in rates will depend on the strength of the recovery coupled with the pinch of industry supply from factors besides just truck production – like rising insurance costs and limited driver supply.”
Intermodal still struggling
The intermodal price index declined 3.8% sequentially and 16.8% year-over-year in June. Ross said roughly 5% of the decline has to do with lower diesel prices, which the index includes. Ross was “surprised rates are not stronger” as the year-over-year intermodal volume comparisons improved through June. He said contract pricing still lagging TL is likely the culprit.
J.B. Hunt reported a 6% year-over-year decline in intermodal revenue per load, basically flat excluding fuel. Actual pricing has moved lower, but an improved freight mix has helped keep revenue per load flat. The company has priced 80% of its contracts for the year. If the TL market continues to tighten, intermodal pricing will likely begin to inflect positively. J.B. Hunt’s intermodal bid season starts in October.
Ross concluded, “In summary, shipment volumes according to the Cass data showed improvement in June, as we make our way off the 2Q20 bottom. But, this does not paint a favorable picture of the overall U.S. economy, as there is still a long way to go before arriving back even at 2019 levels.”
Click for more FreightWaves articles by Todd Maiden.
