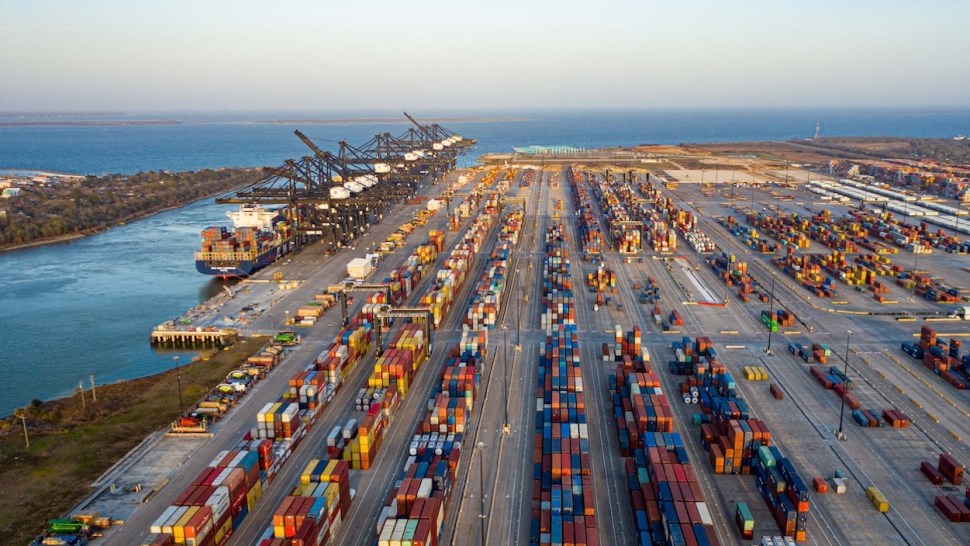
U.S. containerized imports rose 3.8% from July to 2.60 million TEUs in August, supported by higher volumes at major East, Gulf and West Coast ports and broad gains across sourcing countries.
Imports climbed 3.8% from July to 2.60 million TEUs as gains at East, Gulf and West Coast gateways coincided with a broad increase in sourcing-market volumes and rising port transit delays.
Import volume reached 2,603,709 twenty-foot equivalent units (TEUs) in August, the third-highest monthly volume on record, as shippers moved more cargo through major gateways despite growing uncertainty over tariffs, Middle East shipping disruptions and new Panama Canal capacity constraints.
Imports rose 3.8% from July and 3.3% from August 2025, according to Descartes Datamyne data. Only May 2022, when imports totaled 2,622,465 TEUs, and July 2025, with 2,621,910 TEUs, produced larger monthly volumes.
The August total was also 21.5% above the pre-pandemic level recorded in August 2019. While cumulative imports through the first eight months of 2026 remained down 0.4% from the same period a year earlier, the August gain narrowed the year-to-date deficit and pointed to resilient late-summer import demand.
The month-over-month increase was notable because it reversed July-to-August declines recorded in both 2024 and 2025. It also came as importers face a more complicated operating environment, including expanded U.S. tariff exposure, disruption around the Strait of Hormuz, elevated Red Sea security risk and reduced Panama Canal transit availability.
Port volumes broaden
The nation’s 10 largest container gateways handled 84.6% of U.S. containerized imports in August and collectively increased volume by 80,661 TEUs, or 3.8%, from July. Eight of the 10 ports posted monthly gains.
New York/Newark recorded the largest increase, up 24,122 TEUs, or 7.2%, from July. Savannah followed with a gain of 22,761 TEUs, or 9.2%, while Long Beach increased by 12,945 TEUs, or 2.8%.
In the Gulf region, Houston posted an 8,569-TEU increase, up 4.7%. New York-New Jersey gained 8,548 TEUs, or 18.1%. Charleston rose 5,751 TEUs, Tacoma increased 4,829 TEUs and Norfolk added 511 TEUs.
Only Oakland and Los Angeles reported volume declines among the top 10 gateways. Oakland fell 5,628 TEUs, or 7.4%, and Los Angeles slipped 1,748 TEUs, or 0.4%.
The distribution of the gains helped East and Gulf Coast ports regain some share of total U.S. import volume. They accounted for 40.7% of imports in August, up from 39.8% in July. West Coast ports accounted for 43.9%, down from 45% a month earlier.
The shift was modest but reflected the outsized August gains at New York/Newark and Savannah, two of the country’s largest East Coast gateways.
Delays rise at every major gateway
Stronger throughput was accompanied by higher transit delays across all 10 major ports, according to the report.
Houston and Seattle registered the biggest increases. Houston’s average delay rose 1.5 days, from 4.3 days to 5.8 days, while Seattle increased by the same amount, from 6.1 days to 7.6 days. Savannah’s delay rose 1.3 days to 6.1 days.
Los Angeles, Norfolk, New York-New Jersey, Tacoma, Oakland, Charleston and Long Beach also posted more moderate delay increases.
Descartes defines port transit delay as the difference between the estimated arrival date initially listed on a bill of lading and the date on which it receives U.S. Customs and Border Protection-processed bill-of-lading data.
The broad-based rise in delays suggests that operational pressure intensified as imports climbed during the late-summer shipping season.
Gulf Coast momentum continues
Gulf Coast ports continued to gain volume in August, handling 252,675 TEUs, a 4.2% increase from July.
The August total was 11.7% above the Gulf Coast’s rolling 12-month average of 226,120 TEUs and was only 1.9% below the region’s 2026 high of 257,564 TEUs set in May. August represented the second-highest total in the period covered by the report and extended a rebound that began in July.
The increase is significant because the region has become a larger part of importers’ routing and contingency planning as East and Gulf Coast gateways gained share.
China imports rise, but share slips
U.S. imports from China totaled 884,318 TEUs in August, up 1.3% from July and 1.7% from August 2025. Still, China-origin imports remained 13.5% below the record 1,022,913 TEUs handled in July 2024. China accounted for 34% of all U.S. containerized imports in August, down from 34.8% in July, indicating that imports from other sourcing locations expanded more quickly.
Plastics, and furniture and bedding remained the largest product categories in China-origin imports, representing 14% and 13.3% of the total, respectively. Machinery and electrical machinery combined for 17.6%, while toys and sporting goods accounted for 9.9%.
Apparel, made-up textiles and footwear collectively represented 10.7% of August China-origin import volume.
Among the China-origin commodity groups showing year-over-year growth, articles of iron or steel rose 30.5%, glass and glassware increased 29.1%, and plastics climbed 6.9%. Machinery imports declined 9.8% from August 2025, while furniture and bedding fell 5%.
Sourcing growth extends beyond China
The report found import growth was broadly distributed across leading supplier countries.
The top 10 countries of origin collectively increased U.S.-bound container volume by 61,735 TEUs, or 3.5%, from July. Vietnam recorded the largest month-over-month gain, rising 14,545 TEUs, or 5.2%. Thailand increased 11,633 TEUs, or 10.4%, while Indonesia rose 11,198 TEUs, or 19.5%.
China added 11,188 TEUs from July. Germany increased by 5,195 TEUs, South Korea by 4,303 TEUs and Hong Kong by 2,222 TEUs. Italy and Taiwan also posted smaller gains. India was the only top-10 sourcing country to decline, falling 926 TEUs, or 0.8%.
Compared with August 2025, the top 10 sourcing countries collectively added 41,482 TEUs, a 2.3% increase.
China produced the largest year-over-year volume gain, rising 14,795 TEUs. Thailand increased by 12,260 TEUs, Vietnam by 9,878 TEUs, Hong Kong by 8,493 TEUs, Indonesia by 5,375 TEUs, South Korea by 4,545 TEUs and Germany by 4,641 TEUs.
Those gains more than offset declines from India, where imports fell 16,034 TEUs, or 12.8%, and Taiwan, where volumes declined 2,572 TEUs, or 4.5%. Italy was essentially unchanged year over year.
Trade risks cloud outlook
The August import surge occurred against a backdrop of rising supply-chain uncertainty.
Operational conditions around the Strait of Hormuz remained volatile at the end of August. Booking suspensions and reduced operations in parts of the Upper Gulf have required some carriers and cargo interests to consider alternative land-bridge routings, temporary storage arrangements and specialized empty-container return procedures.
For U.S. importers, the direct exposure includes higher transportation costs, reduced schedule reliability and potential disruption to energy and industrial-input supply chains connected to the Persian Gulf region.
Tariff policy also remains a material landed-cost consideration. Section 301 tariffs introduced July 24 apply additional duties across numerous trading partners, generally ranging from 10% to 12.5%, although rates, exemptions and caps differ by country and product. Existing Section 232 duties and China-related Section 301 measures add to the need for importers to assess duty exposure at the individual Harmonized System code level.
Separately, Panama Canal transit capacity tightened in early September after below-expected precipitation in the area watershed. The Panama Canal Authority reduced daily Neopanamax availability to nine slots and Panamax availability to 25 slots beginning Sept. 3, with Panamax capacity scheduled to fall further to 23 slots on Sept. 15.
The changes could affect all-water Asia services moving to East and Gulf Coast ports, particularly for vessels that do not hold secured transit reservations and may face longer waiting times.
Security risks in the Red Sea also remain elevated following renewed Houthi missile and drone attacks against Saudi energy and economic facilities near Jazan on the Red Sea coast. At the same time, major carriers continue to push the return of scheduled services on the Suez Canal route and away from longer diversions around Africa.
Why it matters: August’s performance indicates that U.S. import demand has remained durable even as cargo owners confront a growing set of policy, routing and operating risks.
Read more articles by Stuart Chirls here.
Read more:
Houthi gains deepen risk as carriers restore Red Sea services
Almost 1 million TEUs in new record for this U.S. container gateway
SC Ports, Norfolk Southern expand intermodal access to Huntsville
BNSF, CPKC, and CSX to request broad access to a combined UP-NS network
Brokerage Compliance Symposium
The day before F3. Every compliance issue you face - fraud exposure, carrier liability, FMCSA rules, cargo theft, insurance gaps - navigated by attorneys and operators defining best practices in a changing industry.
F3 Awards Dinner
The night before F3. FreightTech100 companies honored. FreightTech 25 and Shipper of Choice winners revealed live. Cocktail reception into dinner and live music - 300 industry leaders in one purpose-built room.
F3: Future of Freight Festival
Industry-defining keynotes, rapid-fire technology demos, and industry leaders networking in experiences across Chattanooga - plus the inaugural F3 Awards Dinner featuring the FreightTech and Shipper of Choice reveals.
The day before F3. Every compliance issue you face - fraud exposure, carrier liability, FMCSA rules, cargo theft, insurance gaps - navigated by attorneys and operators defining best practices in a changing industry.
The Signal at Chattanooga Choo Choo • Chattanooga, TN Register NowThe night before F3. FreightTech100 companies honored. FreightTech 25 and Shipper of Choice winners revealed live. Cocktail reception into dinner and live music - 300 industry leaders in one purpose-built room.
The Signal at Chattanooga Choo Choo • Chattanooga, TN Register NowIndustry-defining keynotes, rapid-fire technology demos, and industry leaders networking in experiences across Chattanooga - plus the inaugural F3 Awards Dinner featuring the FreightTech and Shipper of Choice reveals.
The Signal at Chattanooga Choo Choo • Chattanooga, TN Register Now