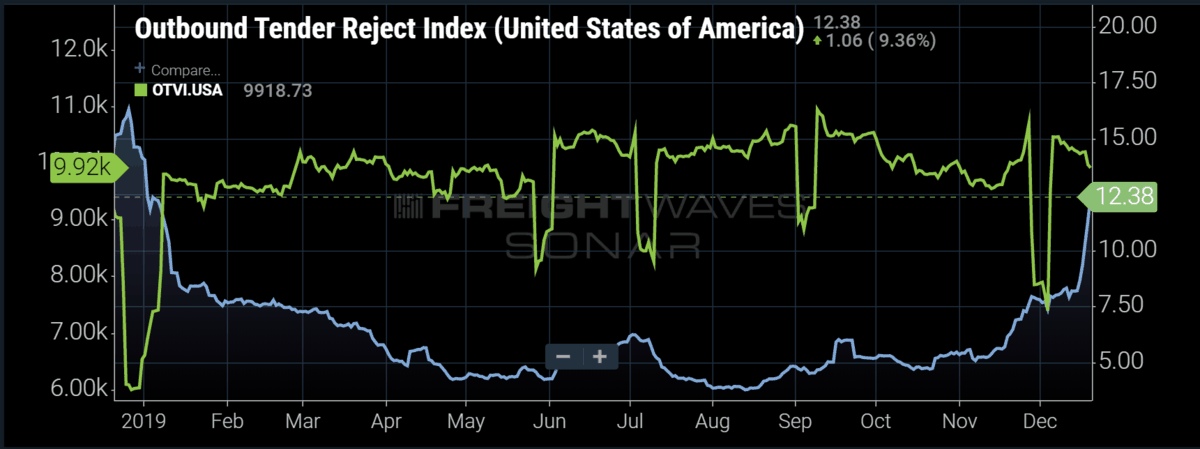
Chart of the Week: Outbound Tender Rejection Index – USA, Outbound Tender Volume Index – USA SONAR:OTRI.USA, OTVI.USA
The 2019 freight market was a shadow of 2018 in terms of capacity. Spot rates hit all-time highs as carriers rejected over 25% of their contracted freight requests in June of last year. Since that time, carriers became much more compliant, rejecting as few as 3.8% of their loads in early August this year as volumes retreated and capacity grew. Over the past week FreightWaves national Outbound Tender Rejection Index (OTRI) broke 12% for the first time since January 4, 2019, a decent signal of shifting market conditions. The real question is whether this is a signal of the freight market pendulum swinging back in the direction of a 2018.
Tender rejection rates are a measure of capacity in the trucking market—measuring the rate at which carriers reject contracted freight tendered by shippers. The higher the rejection rate the tighter the market with increasing upward pressure on spot rates. Carrier’s do not reject contracted freight from existing customers without a strong reason. Most of those reasons are based on dollar amounts, either from excessive cost of re-positioning equipment or substantial revenue from higher paying freight.
Looking at truckload volumes on FreightWaves Outbound Tender Volume Index (OTVI.USA), demand is much stronger than it was a year ago, averaging over 8% higher since December 5. Demand is only one side of the story, as any economics professor will tell you. The mad dash to buy equipment in 2018 has left the market in a state of over-supply for most of the year, but is this recent tightness a sign of correction to that supply?
Two Peaks Show Direction
Trucking has two seasonal peaks—one in the summer around the end of June and another in late November into December. The direction of the market can generally be gauged by the relationship between these two peaks. If the summer peak where spot rates and rejection rates are higher than the winter values, the market is softening. If the opposite occurs, like the pattern we see now, the trucking sector is in an expansion cycle.
Tender rejection rates are closely correlated with spot market prices, meaning the values move together. Seeing as tender rejections have blown through their summer levels, it is safe to say once the Christmas season ends winter spot rates will have exceeded summer rates.
On the demand side, volumes have averaged over 5% higher since November 20 y/y, due to a stronger than anticipated retail showing. Freight volumes in the 4th quarter are typically driven by the retail sector, as is the general economy, due to holiday spending driven by the consumer.
But Winter is Coming
There are ongoing concerns along with the positive signals. Even with the retail continuing to excel, January is typically a dismal month in this sector. Looking at the Cass Freight Shipments Index—an index measuring total freight volumes for both rail and trucking—there is a drop every year in January. Even in years of significant growth, such as 2017-18, there is a drop in freight volumes.
The industrial sector made up of manufacturing, mining, electricity, and gas normally drives volumes in the 1st quarter as many capital goods orders are made in the 4th quarter as businesses evaluate budgets and spend cash if available. The industrial side of the U.S. economy has been in negative year-over-year growth since August according to the Federal Reserve Board.
Another potential pitfall of this winter is the fact imported retail shipments that filled warehouses in late 2018 and early 2019 resulting from the tariff panic have fizzled, falling over 20% according to FreightWaves customs shipments data. Many of these shipments kept carriers busy this year, and they will be largely absent moving forward.
Mixed Emotions
The market is of course giving mixed plenty of mixed signals, as has been the case over the past year. The geopolitical climate has left many businesses struggling to make any long-term decisions after over-spending a year ago, but consumers are still spending as much as they ever have. The resulting volatility has taken its toll on trucking this year as trucking failures hit multi-year highs.
Volumes will decline seasonally over the next few months which will push more companies out of the space, leaving most of 2020 with less drivers on the road. The biggest question will be if demand holds through an election year where uncertainty is typically at its highest — just what the market needed.
About the Chart of the Week
The FreightWaves Chart of the Week is a chart selection from SONAR that provides an interesting data point to describe the state of the freight markets. A chart is chosen from thousands of potential charts on SONAR to help participants visualize the freight market in real-time. Each week a Market Expert will post a chart, along with commentary live on the front-page. After that, the Chart of the Week will be archived on FreightWaves.com for future reference.
SONAR aggregates data from hundreds of sources, presenting the data in charts and maps and providing commentary on what freight market experts want to know about the industry in real time.
The FreightWaves data science and product teams are releasing new data sets each week and enhancing the client experience.
To request a SONAR demo click here.
