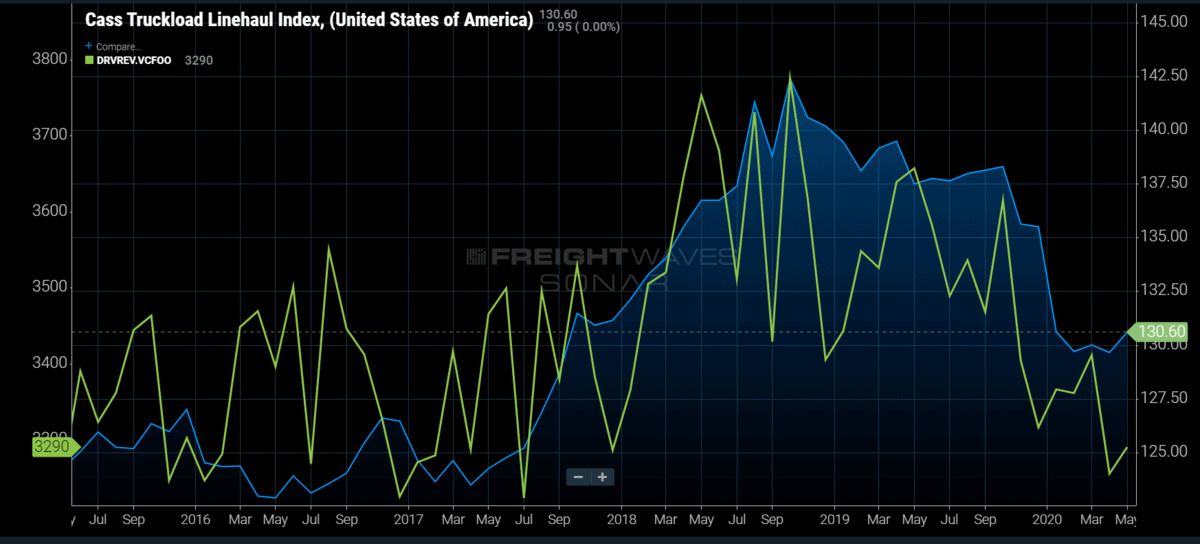
Chart of the Week: Cass Truckload Linehaul Index – USA, Revenue per Driver per Week – Van Company and Leased Fleet SONAR: CTLI.USA, DRVREV.VCFOO
The Cass Truckload Linehaul Index is showing a massive drop-off in truckload prices this year, which may be more indicative of a deterioration of contracted pricing than the much more transparent spot market.
A strong connection exists between the Cass index and the Truckload Carriers Association revenue per driver per week for its dry van members. Both values peaked in October 2018 and have since fallen back to 2017 levels. With most of the dry van market considered to be contracted freight, 2020 could get even uglier for many carriers if spot rates do not pick up quickly.
The Cass Truckload Linehaul Index is a measure of pure truckload cost and does not include accessorial charges like detention and fuel. The index is based on freight invoices, which include a large concentration of contracted freight bills.
Unlike the spot market, the contracted freight market is much more stable and dependent on annual cycles for timing of adjustments. Most dry van freight moves under a contracted agreement in which a shipper and carrier agree to long-term pricing in certain lanes if the carrier has capacity. Contracted freight rates drive most of the revenue for dry van carriers.
Typically, carriers do their best to honor their contracted agreements, offering capacity over 95% of the time in stable market conditions — something seen in most of 2019. When it becomes too costly or there are much higher-paying options, carriers can make the financially driven decision to utilize their trucks for other purposes.
This is fair, considering most shippers do not offer loads more than three days in advance, leaving the carrier little time to make network adjustments. A truck can travel around 500 miles a day in low traffic conditions safely, meaning it can take a truck five days to move from New York City to Los Angeles. Managing trucking networks is the most difficult part of trucking in larger fleets.
The falling Cass index, which declined over 6% for the first three months of 2020, is an indication that carriers pulled back on some of their rates this year on their contracted accounts. This means that they will be making less revenue for hauling the same amount of freight.
2019 was a year of oversupply with a muted spot market, but carriers had the benefit of negotiating contracts on 2018 conditions. This gave them more revenue to help pad the income statement. With contract rates falling and costs, such as insurance, remaining elevated, carriers will be in a tighter position than they had last year.
The good news is that for the time being, truckload volumes have recovered much faster than many anticipated. The national Outbound Tender Volume Index (OTVI) indicates volumes are approximately 5%-8% higher this year versus last through the first few weeks of June. Higher volumes have not translated to much higher rates yet, but if they remain at this level, spot rates will inevitably follow, giving carriers a healthier mix of better-paying options.
The question still remains around the sustainability of the quick recovery as unemployment numbers remain at historic highs and the industrial economy continues to sputter. Retail and consumer sentiment have bounced back, however, and a resurgence of the threat of another trade war has spooked shippers into preparing for returning demand.
If volumes recede to 2019 levels, it will not be demand that drives rates higher in 2021 but the reduction of capacity as many carriers will be forced to park their trucks. This is especially true for those that cannot find replacement freight from the sectors hit hardest by the COVID-19 outbreak like auto and equipment manufacturing.
About the Chart of the Week
The FreightWaves Chart of the Week is a chart selection from SONAR that provides an interesting data point to describe the state of the freight markets. A chart is chosen from thousands of potential charts on SONAR to help participants visualize the freight market in real time. Each week a Market Expert will post a chart, along with commentary, live on the front page. After that, the Chart of the Week will be archived on FreightWaves.com for future reference.
SONAR aggregates data from hundreds of sources, presenting the data in charts and maps and providing commentary on what freight market experts want to know about the industry in real time.
The FreightWaves data science and product teams are releasing new data sets each week and enhancing the client experience.
To request a SONAR demo, click here.
