

This week’s FreightWaves Supply Chain Pricing Power Index: 35 (Shippers)
Last week’s FreightWaves Supply Chain Pricing Power Index: 35 (Shippers)
Three-month FreightWaves Supply Chain Pricing Power Index Outlook: 40 (Shippers)
The FreightWaves Supply Chain Pricing Power Index uses the analytics and data in FreightWaves SONAR to analyze the market and estimate the negotiating power for rates between shippers and carriers.
This week’s Pricing Power Index is based on the following indicators:
Tender volumes fall for the second consecutive week
The freight market is ending September on a sour note as tender volumes took a leg lower to close out the quarter. An International Longshoremen’s Association strike possibly starting Tuesday could create disruptions to the demand side, especially once the strike ends, with the disruptions being much more severe the longer the dispute drags on.

To learn more about FreightWaves SONAR, click here.
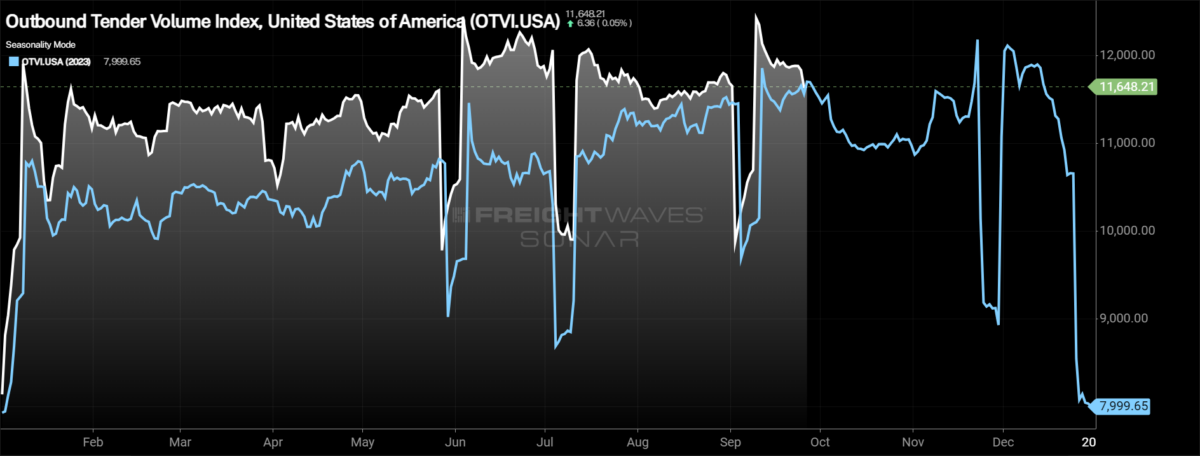
The Outbound Tender Volume Index (OTVI), a measure of national freight demand that tracks shippers’ requests for trucking capacity, is down 1.94% week over week as volumes took another leg lower to close out the month. The gap with year-ago levels is now as narrow as it has been all year, up just 0.07% year over year.
To learn more about FreightWaves SONAR, click here.
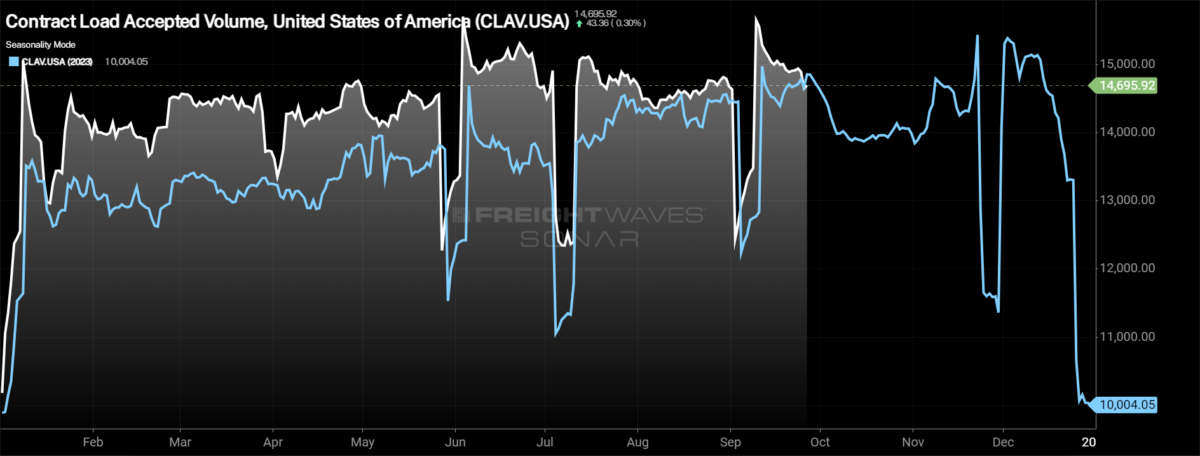
Contract Load Accepted Volume (CLAV) is an index that measures accepted load volumes moving under contracted agreements. In short, it is similar to OTVI but without the rejected tenders. Looking at accepted tender volumes, we see a decrease of 1.52% w/w. The smaller decrease than the OTVI is due to tender rejection rates dropping over the past week.
Bank of America’s recent credit and debit card spending report shows that spending is holding on throughout September. In the most recent report, for the week ending Sept. 21, total card spending was flat year over year. Many of the same categories that have been lower throughout the year continue to be drags on overall spending. Furniture and home improvement have been steadily lower y/y, down 7.7% and 4.8%, respectively. With Hurricane Helene making landfall Thursday and significant damage occurring from Florida up through North Carolina, spending will likely show a slowdown in the coming weeks.

To learn more about FreightWaves SONAR, click here.
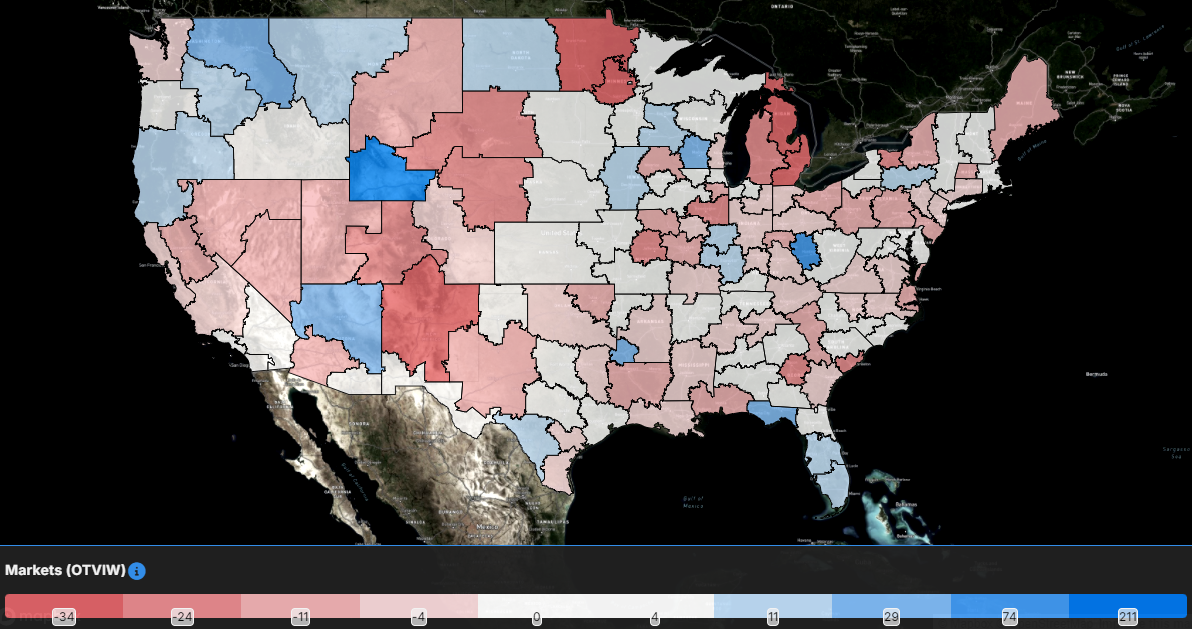
As expected with an over 1% drop in tender volumes at the national level, the majority of the freight markets experienced lower volumes over the past week. Of the 135 freight markets tracked within FreightWaves SONAR, 63 experienced higher volumes compared to last week.
Much of the tender volume growth week over week was isolated to smaller freight markets like Huntington, West Virginia, and Green River, Wyoming, where volumes were up over 70% week over week.
Despite the decline in overall volumes, the two largest markets in the country saw volumes grow over the past week. Volumes in Ontario, California, grew by 2.75% w/w, while volumes in Atlanta were 0.5% higher w/w.
To learn more about FreightWaves SONAR, click here.
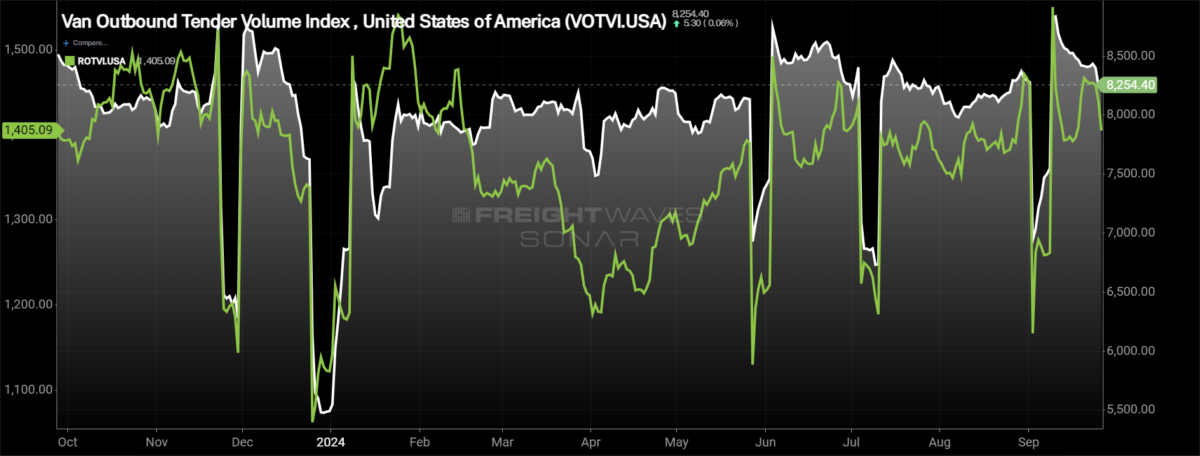
By mode: The drop in tender volumes was felt by both the dry van and reefer markets. The Dry Van Outbound Tender Volume Index held up slightly better than the reefer market, falling by 1.97% w/w. With the decline this week, dry van volumes have turned negative y/y, down 2.48% at present.
The reefer market has remained quite volatile, with the past week showing a fairly sharp decrease in volumes. The Reefer Outbound Tender Volume Index dropped by 2.95% w/w, one of the largest weekly non-holiday-related drops of the year. Despite the drop in volumes this week, reefer volumes have still grown over the past year, up just 0.69%.
Rejection rates move lower to close the third quarter
Capacity remains readily available across the country, able to service any changes in demand with relative ease. Traditionally, the end of the quarter and the end of the month create a little added pressure on the market as time sensitivity intensifies, but the opposite has happened this year. Tender rejection rates remain in a range that indicates that the market is extremely loose.
To learn more about FreightWaves SONAR, click here.
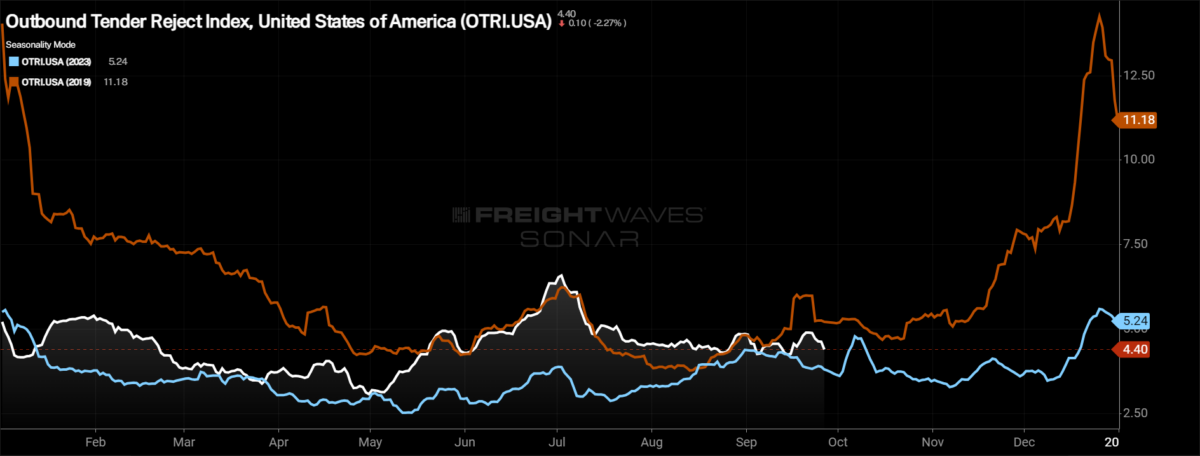
Over the past week, the Outbound Tender Reject Index (OTRI), a measure of relative capacity, decreased by 21 basis points to 4.4%, approaching the lows seen immediately after the Labor Day holiday. The OTRI is now 66 basis points above last year’s levels, a signal that while it doesn’t feel tighter because rejection rates are still below 5%, rejection rates are higher in aggregate. The market has diverged from the 2019 levels in recent weeks, as the OTRI is 82 bps below where it was this time in 2019.

To learn more about FreightWaves SONAR, click here.
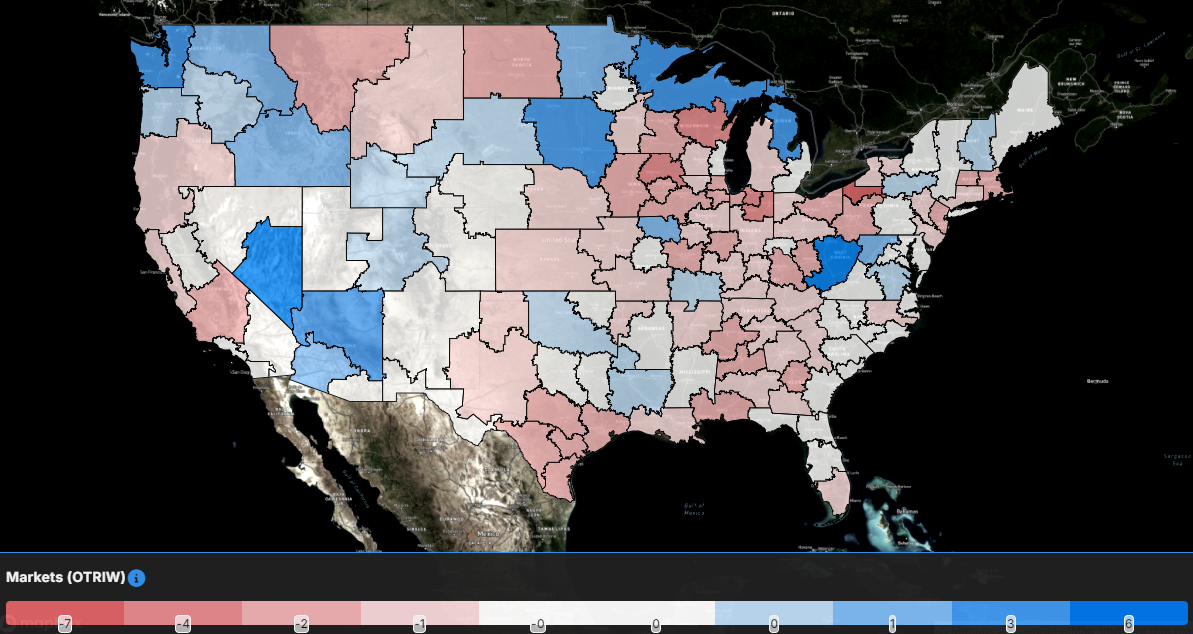
The map above shows the Outbound Tender Reject Index — Weekly Change for the 135 markets across the country. Markets shaded in blue are those where tender rejection rates have increased over the past week, whereas those in red have seen rejection rates decline. The bolder the color, the more significant the change.
Of the 135 markets, just 40 reported higher rejection rates over the past week, a significant decrease from 92 in last week’s report.
The largest increases in the country were in the smaller freight markets by outbound volume, including Las Vegas, where rejection rates rose by 610 basis points over the past week.
All of the largest freight markets in the country saw rejection rates decline over the past week, including Los Angeles, where they fell by 32 bps. Compared to the national average, that isn’t too bad. In the major Midwest market of Chicago, tender rejection rates dropped by 156 bps over the past week, one of the largest decreases across the country and certainly the largest in a major market.
To learn more about FreightWaves SONAR, click here.
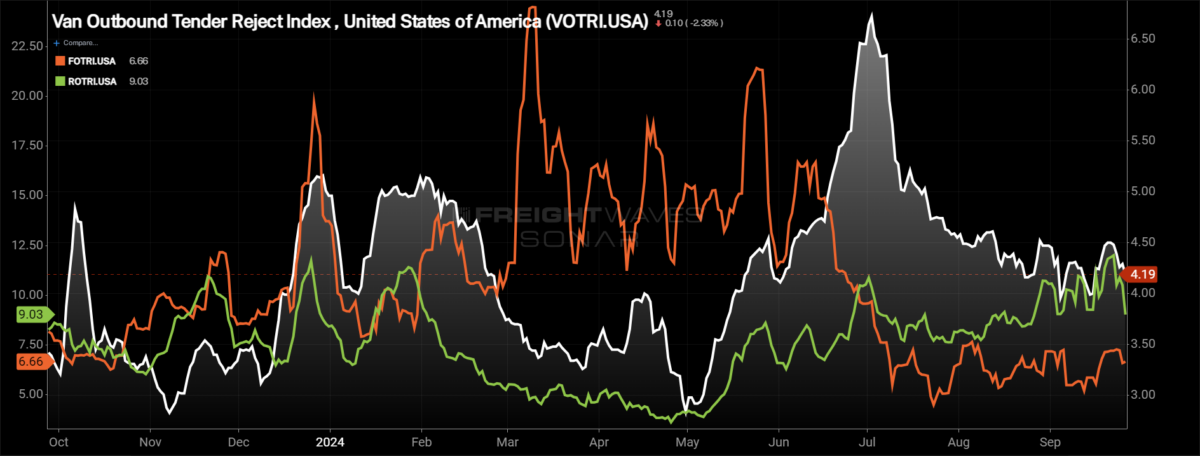
By mode: The dry van market was showing some positive signs throughout the middle of September, but that was short-lived. The Van Outbound Tender Reject Index fell by 28 bps over the past week to 4.19%.
The reefer market volatility remains, as the overarching theme is moving to a tighter market, but the past week saw a drop in reefer rejection rates. The Reefer Outbound Tender Reject Index fell by 235 bps w/w, the largest weekly drop since February, to 9.03%.
The flatbed market joined in on the fun this week as well, as tender rejection rates retreated after a brief boost last week. The Flatbed Outbound Tender Reject Index fell by 48 bps to 6.66%. It will be interesting to see the impacts that disaster relief has on the flatbed market as cleanup begins on areas affected by Hurricane Helene.
Spot rates’ weekly drops among the largest
With the market taking a noticeable breather to close out the quarter, spot rates fell as a result. Spot rates are holding on to the gains established during International Roadcheck, but just by the skin of their teeth. Spot rates excluding fuel are less than 10 cents per mile from the lows established in late April and early May.
To learn more about FreightWaves SONAR, click here.
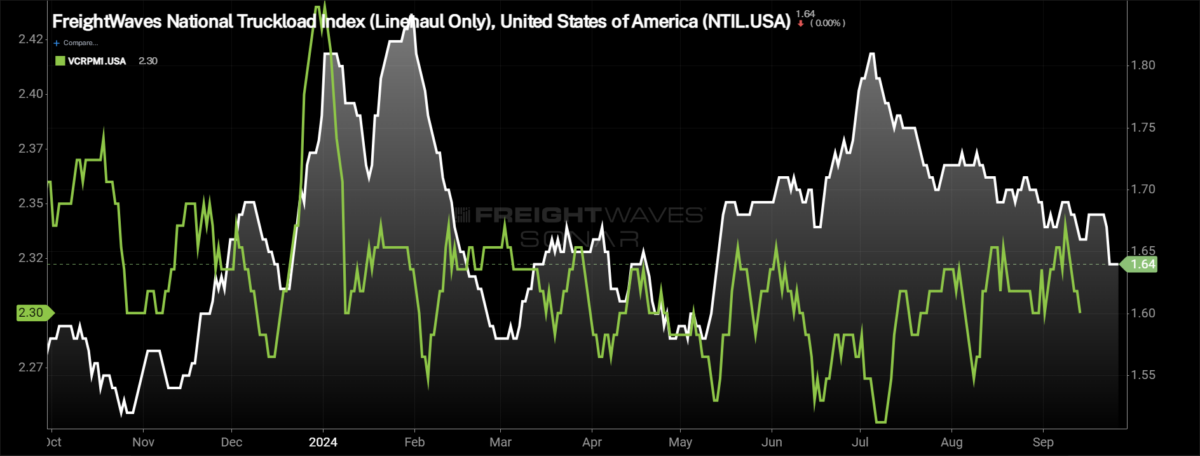
This week, the National Truckload Index — which includes fuel surcharge and various accessorials — suffered one of the largest weekly declines of the year, falling by 5 cents per mile to $2.20. The NTI is now 7 cents per mile or 3.1% lower than it was this time last year. The decline in the linehaul variant of the NTI (NTIL) — which excludes fuel surcharges and other accessorials — wasn’t quite as severe, falling by 4 cents per mile to $1.64. The NTIL is 8 cents per mile higher than it was at this time last year. The discrepancy in the NTIL and NTI is solely the changes in fuel, which was far more expensive in 2023 than currently. The average diesel truck spot price per gallon is 6 cents, or 20.9%, lower than it was last year.
Initially reported dry van contract rates remain in a fairly tight range, falling by 2 cents per mile over the past week to $2.31. Throughout 2024, contract rates have been in a tight range, an indication that the extreme cost savings are in the rearview mirror and service is now coming to the forefront. Initially reported contract rates are down 5 cents per mile from this time last year, a 2.1% decline.
To learn more about FreightWaves SONAR, click here.
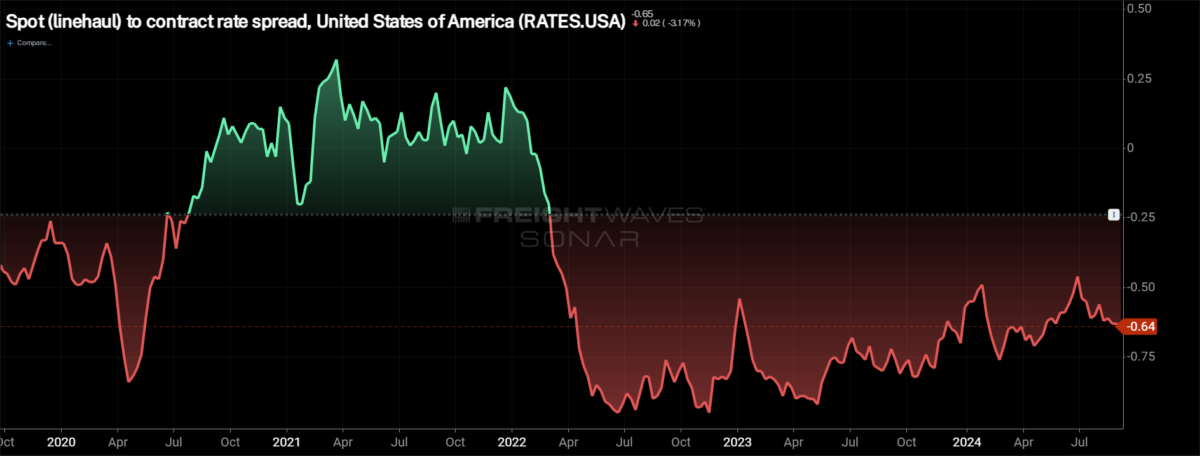
The chart above shows the spread between the NTIL and dry van contract rates is trending back to pre-pandemic levels. The spread remains historically wide and has actually widened in recent weeks, diverting from the pre-pandemic average that it had been inching closer to throughout the year. Significant disruptions can quickly tighten the spread as spot rates react much faster, so seeing a narrowing of the spread in the fourth quarter, during truckload peak season, wouldn’t be a surprise. The question is how significant the narrowing is and whether it is sustainable, especially if the first quarter of 2025 is the traditionally soft period for freight demand.

To learn more about FreightWaves TRAC, click here.
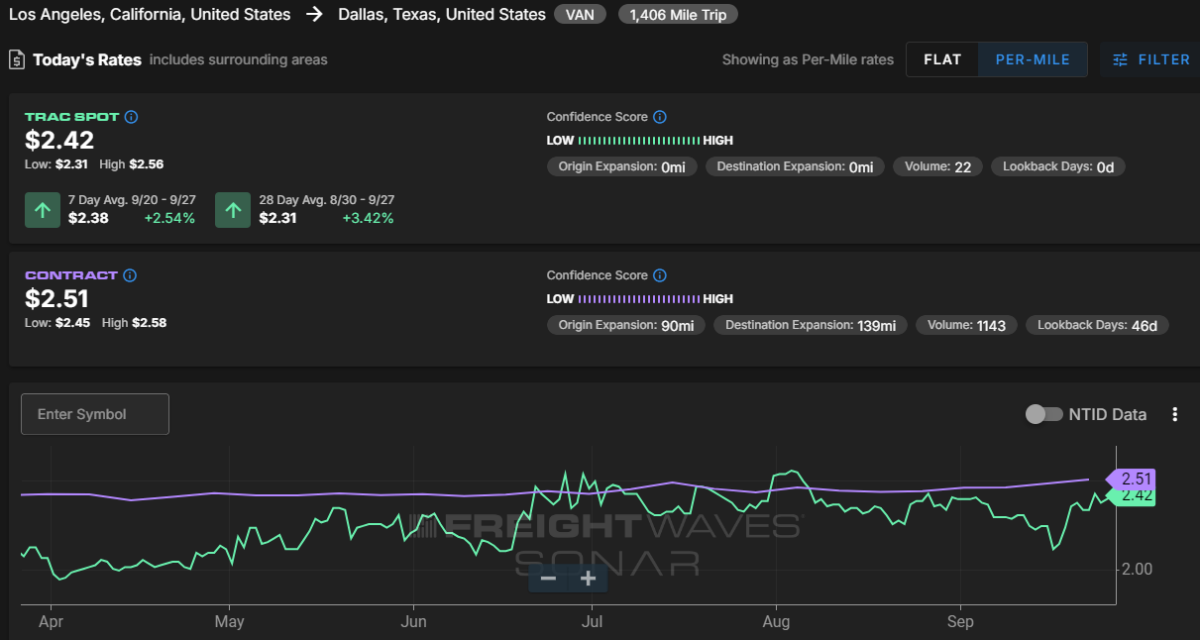
The FreightWaves Trusted Rate Assessment Consortium spot rate from Los Angeles to Dallas continued to move higher over the past week. The TRAC rate from Los Angeles to Dallas increased by 6 cents per mile to $2.42. Spot rates along this lane are now just 9 cents per mile below the contract rate.

To learn more about FreightWaves TRAC, click here.
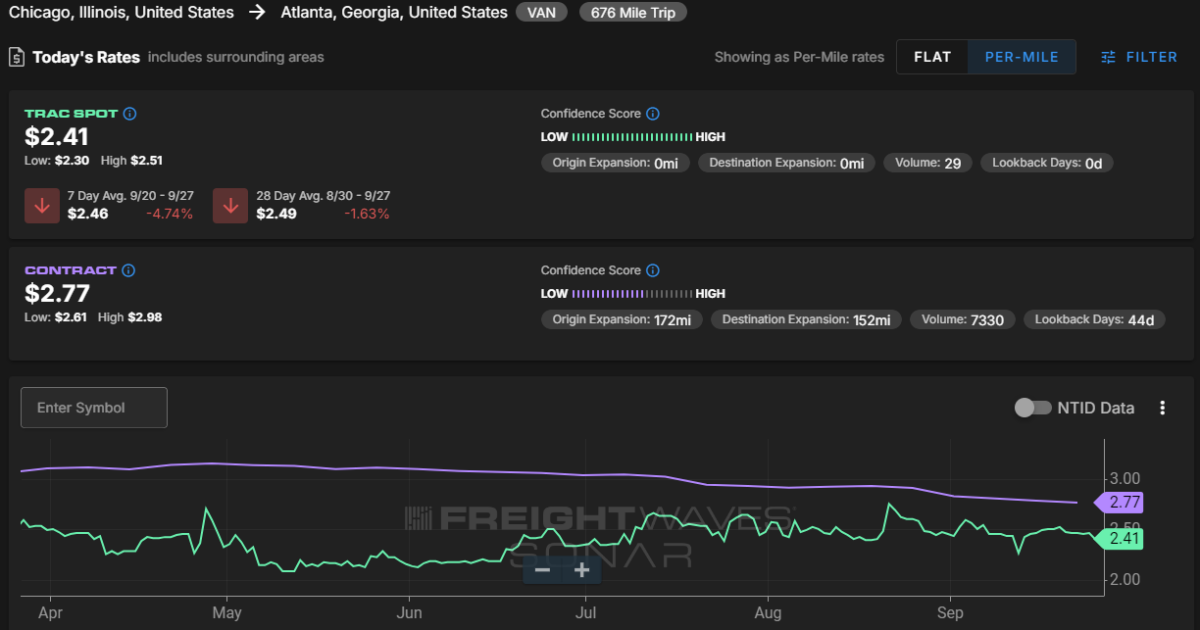
From Chicago to Atlanta, spot rates gave back some of the recent increases. The FreightWaves TRAC spot rate along this lane fell by 12 cents per mile to $2.41, now 36 cents per mile below the contract rate.