

The trucking market is on fire: few would debate this fact. While there has been some softness in specific markets this year, that appears to be behind us. The only market in the country that seems to be suffering is the Pacific Northwest, but that should come as no surprise to anyone that has been around for a while.
A lot of people attribute the capacity crunch to the ELD mandate and the havoc it is credited with wreaking over the freight markets. Few carriers want to see the strength in the market change and while many single operators want a reprieve from the ELD mandate, no one wants the tightness to subside. So the recent FMCSA guidance regarding personal conveyance guidance has been a hot topic and whether this clarification runs the risk of allowing drivers to pursue creative accounting once again. While it does make the rules a bit more flexible, it is unlikely to change the capacity situation for carriers anytime soon.
To reach this conclusion, we went to SONAR‘s data. We wanted to understand where the ELD mandate has been most impactful and where we are seeing carriers respond. After looking at hundreds of billions of dollars worth of freight transactions and billions of ELD data points, we have concluded that the personal conveyance clarifications will not have an impact on capacity. The changes to the rules clarify local moves under 150 air-miles, but will not impact any longer hauls.
The ELD-driven capacity pressure has been most pronounced in segments of the market that are not subject to this exception- i.e. 250 miles and above. As the length of haul increases, the rejections do as well, indicating that carriers are being far more intentional about their freight selection criteria.
We have divided the market in a number of segments based on length of haul: Local (CTRI) <100 miles, short-haul (STRI) (100-250 miles), mid-haul (MTRI) (250-450 miles), tweener (TTRI) 450-800 miles, and long-haul (LTRI) 800+ miles.
The tweener market describes a length of haul of 450 to 800 miles. The name comes from “in between” short haul and long haul loads. Short haul loads are considered a load where a driver can complete in a single day, while long-haul typically describes two-day transit times. Between 2003 and 2018 tweeners were the most challenging place for the large enterprise carriers to play, while the owner operators and brokers made bank. Because the enterprise carriers were required to maintain compliance with the rules, due to the fact that a log audit was most certainly in their future, the smaller carriers who were unconcerned with this were able to thrive in the tweener market.
A shipper that wanted next day transit on a load that had a tweener length of haul couldn’t rely on a large carrier to perform such a task. They would require two days transit, or would price the load such that they were uncompetitive against the smaller carrier or freight broker. The rationale was that a tweener load would knock any real utilization out for that truck for two days and it must be priced accordingly. A trucker who could do the same load in a single day that took an enterprise carrier two days would have the real economic advantage. After all, the capacity constraint in the market is not the amount of miles a trucker can drive, but rather the amount of hours they have to do so. In a world where the government sets the rules at 11 hours of driving time, this means that the maximum miles a driver can do in a single day is reflective of how much distance they can get on a load within 11 hours.
Of course, this only matters if you care about maintaining compliance. Carriers that had ELDs (enterprise carriers) adhered to the 11 hour restriction, while owner operators largely did not.
The question becomes, what does this mean for the freight market and is it taking capacity out of the system? The only way to answer this question is to look at the data. For this study, we used SONAR’s OTRI (Outbound Tender Reject Index) USA to understand what loads are being refused and therefore what parts of the market are seeing the most capacity shortages.
Here is what we have seen:
This is tender reject index for the entire USA (OTRI.USA):
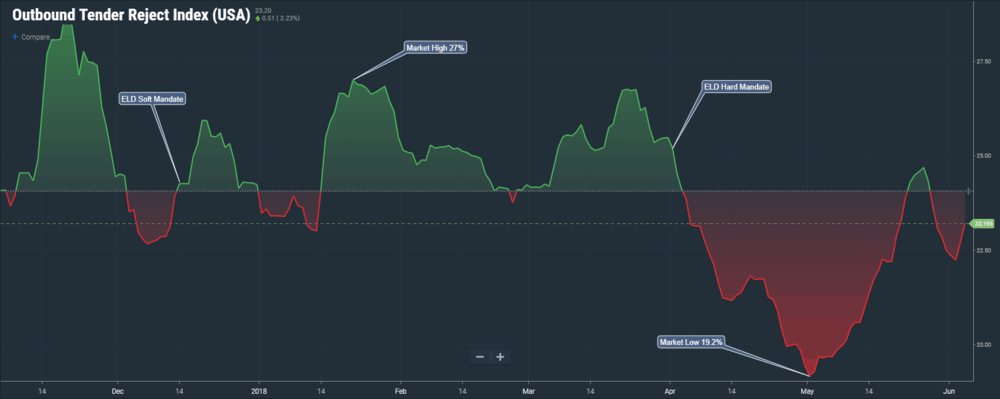

When the soft mandate went into effect on December 16, 2017, tender rejects were at 24.26%. They peaked on January 21st at 26.97%. They stayed within the range of around 25%, falling fast as soon as the hard mandate went into effect on April 1, 2018. They found their bottom in early May at 19.19% and have trended up since then.
We consider this the baseline as to measure everything else against.
First up is local (city) tender reject index (CTRI.USA) (less than 100 mile LOH):
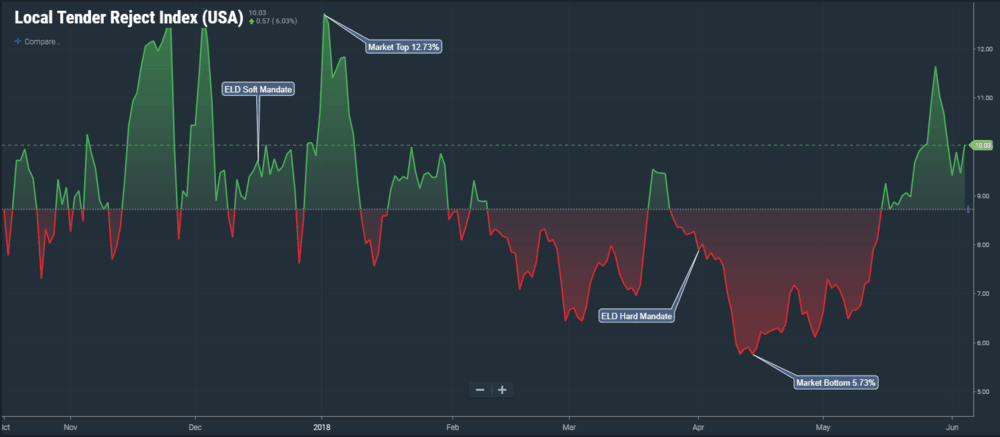

The local market (intra-city) should not see a lot of impact to the ELD mandate. This seems to bear out in the data. In fact, the market high is around 12.10%, which happened at the start of our data, or January at 12.77%. The market sees the bottom at 5.77% in Mid April (maybe drivers were working hard to pay their tax bills) and then rallying back towards 12% going into Memorial day.
Second is short haul tender reject index (STRI.USA) 100-250 mile LOH:
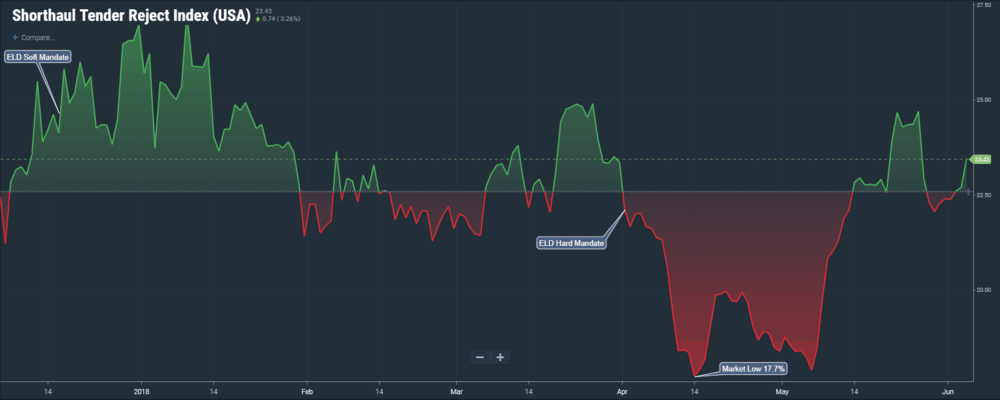

The short haul (not local index) seems to support the concept that shorter lengths of haul will not see big turndown numbers. When the ELD soft mandate went into effect, the rejections in the market were 24.19%. They rallied as high as 27.49% on January 9th, but were below the early December numbers through most of the start of the year. They saw significant weakness from mid April to the second week of May, rallying since then.
Third is mid-haul length of haul (MTRI.USA) 250-450 LOH:
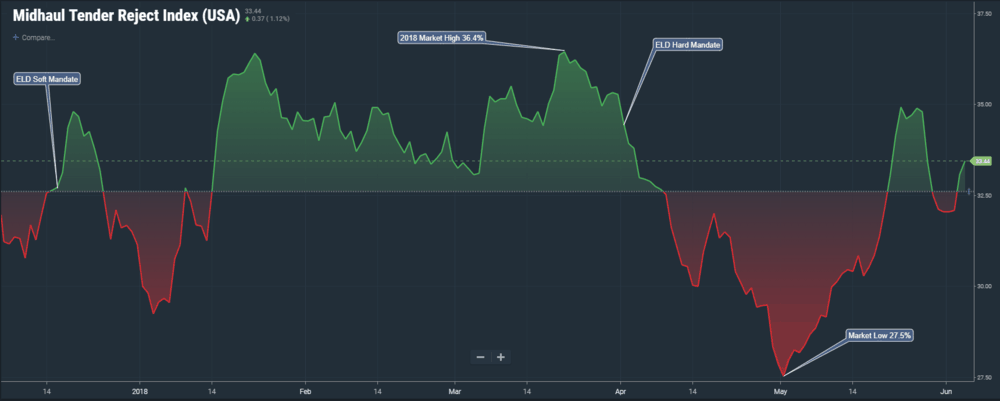

We start to see real pressure in the market by looking at loads that had more than 250 mile length of haul. The rejections were upon the ELD mandate for this market were 32.43%. They bottomed to 29.23% in early January and rallied through the end of March to 36.43%. When the ELD hard mandate hit, the rejections were 34.51%, dropping down to 27.5% in early May, then rebounding closer to the 35% near Memorial day.
Next up is the tweener market (TTRI.USA) 450-800 mile LOH:
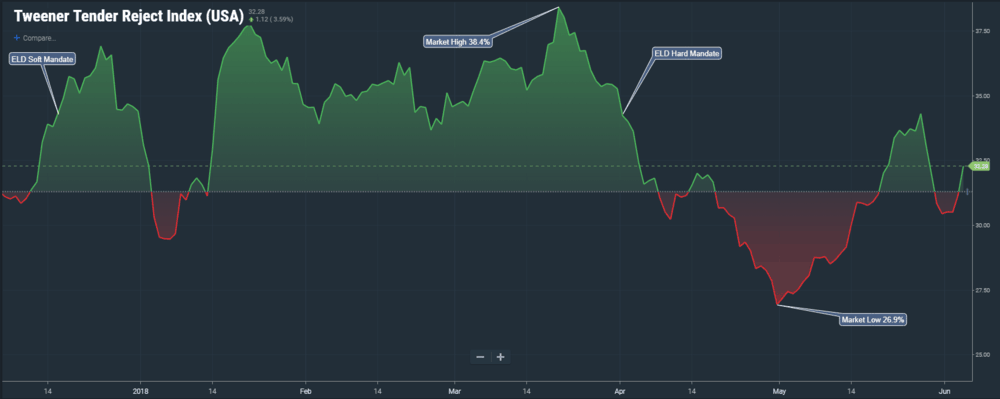
In the tweener market, we see that rejections were 33.83% when the ELD soft mandate hit. They peaked right on Christmas eve at nearly 37% and then dropping to 29.48% in early January. The rejections stayed super hot from Mid January, setting a new range of staying hot by staying between 33.43% and 38.41% through March. When the hard mandate went into effect on April 1st, the rejections dropped until bottoming out at 27.01% and then marching up towards 34% around Memorial day. The tweener market has similar peaks and troughs as the mid haul market, but notice the higher volatility in tweener turndowns for January through April as compared to mid haul.
Last, we can take a look at the long haul market (LTRI.USA) 800 miles LOH or greater:
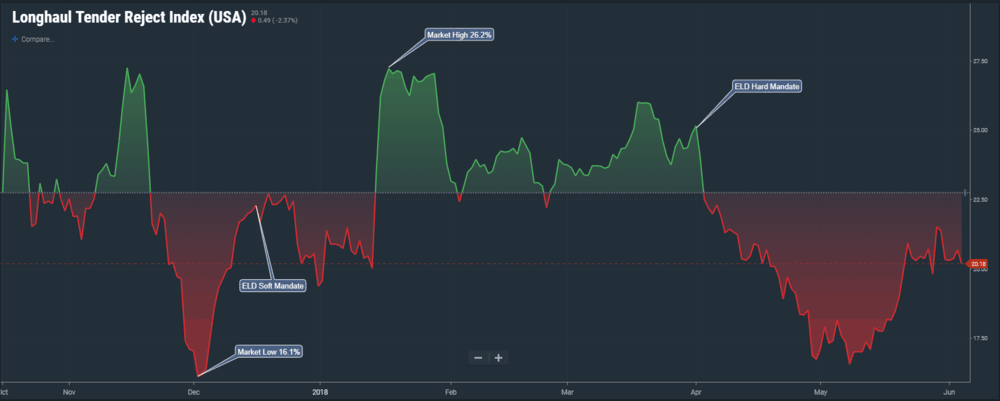
The long-haul chart looks a bit bipolar. We didn’t see much of an increase in rejections after the ELD mandate until mid January, where we saw this dramatic increase on January 13 that peaked to 26.20%. We then saw similar trends to the other charts where the market stayed tight throughout March and then dropped dramatically in early April. The bottom was set on May 7th at 16.47% and has been rallying since. We are currently at 20.18%.
What can we conclude from all this? We don’t see much pressure in the local markets. We see more pressure as the length of haul goes up from 250, with the most pressure being in the tweener market. The long-haul market is seeing some rejections, but they are not nearly as pronounced as the tweener market.