


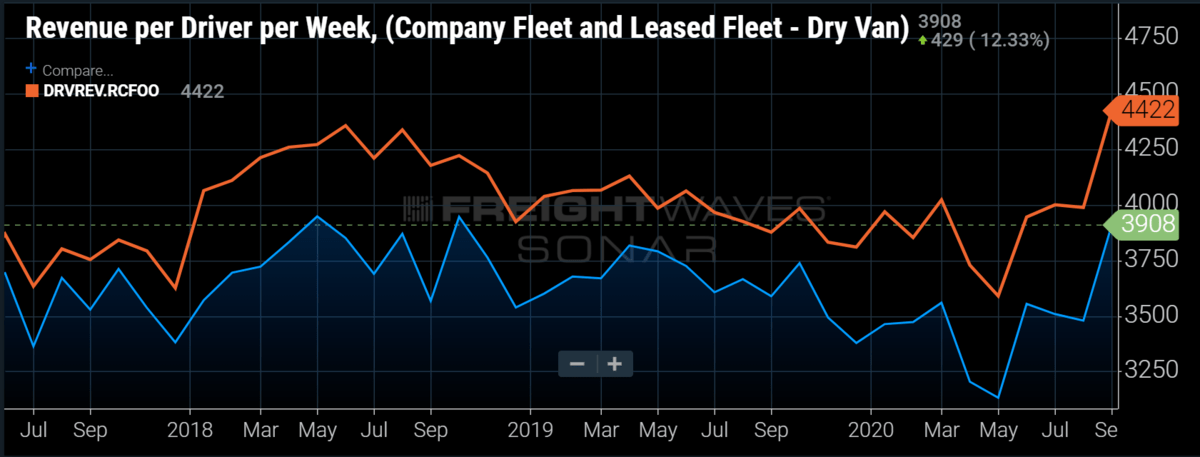
Chart of the Week: Revenue per Driver per Week – Dry Van and Reefer Carriers SONAR: DRVREV.VCFOO, DRVREV.RCFOO
According to the Truckload Carriers Association, reefer carriers are experiencing more expansion in revenue than dry van. Reefer carriers have seen revenue per driver per week increase from $3,944 in June to $4,422 in September, while dry van carriers are seeing a 10% expansion in revenue efficiency over the same period. While this may not be a terribly shocking figure during the warmer months, other data points to reefer carriers increasing their lead over dry van into the colder months, when retail tends to take the stage.
The three main trailer or equipment types in for-hire trucking are dry van, refrigerated (reefer) and flatbed. Dry van carriers occupy the gross majority of the market in this space due to the amount of general commodities they can carry in relation to the other two. Reefer operations tend to be more expensive and more specialized, which limits their availability. The limited availability in relation to van makes reefer capacity more volatile in nature.

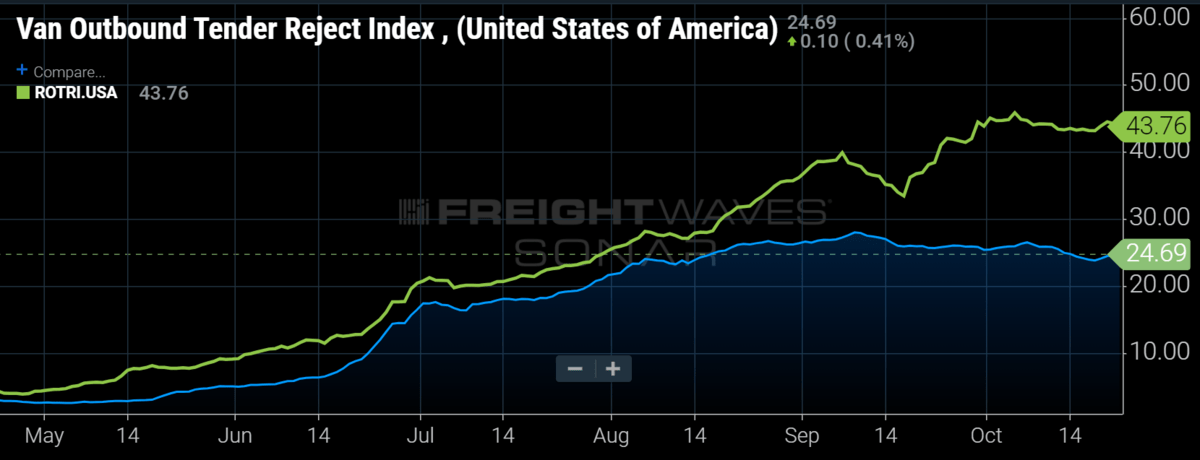
Most of the time, reefer and van rates and capacity move in sync with each other, but beginning in mid-August, that dynamic started to change. Looking at the Reefer Outbound Tender Rejection Index (ROTRI) compared to the Van Outbound Tender Rejection Index (VOTRI) for the U.S., reefer rejection rates began to increase at a much faster rate than their dry van counterparts. After moving nearly in synchronization since May, what could have caused this shift?
Digging deeper into the data, the Northwest and Mountain regions of the U.S. have had the largest increases in reefer rejection rates over the past few months. Wildfires and extreme drought have threatened much of the produce moving out of this region, which includes the items many consider staples of the region like apples and potatoes. But there are many other items that originate in this region such as cherries, blueberries and hops that begin their harvests in the late summer months. So why is this important for the rest of the country?
In 2017, California had one of the wettest springs on record — a far cry from 2020 — delaying the harvest of many produce staples like lettuce and strawberries that fill many food suppliers’ shelves in the U.S. Unlike many of the goods that move on dry van trailers, these items have a short shelf life, meaning that transportation in a timely manner is critical.
Spoilage is one of the main threats to farmers’ and food suppliers’ revenues and profitability. Approximately one-third of the food produced globally goes to waste in some form or fashion, costing roughly $1.2 trillion, with roughly a quarter of that being attributed to distribution and retail.
For this reason, food suppliers will spend more money ensuring that most of the product reaches shelves to reduce the far greater losses that would occur if they let large portions of the harvest spoil. The transportation prices can soar as much as 10-15 times the current market rate at times.
So even if there is a harvest in the Northwest, carriers will divert their attention in order to take advantage of these short-lived bursts of demand due to the abnormally high rates. With food supply chains already experiencing significant disruption due to the pandemic, reefer carriers are seeing average rates over $5 per mile in many markets in the U.S. With the holiday period around the corner, and dry van capacity also being strained, reefer rates could expand even further in the fourth quarter.
About the Chart of the Week
The FreightWaves Chart of the Week is a chart selection from SONAR that provides an interesting data point to describe the state of the freight markets. A chart is chosen from thousands of potential charts on SONAR to help participants visualize the freight market in real time. Each week a Market Expert will post a chart, along with commentary, live on the front page. After that, the Chart of the Week will be archived on FreightWaves.com for future reference.
SONAR aggregates data from hundreds of sources, presenting the data in charts and maps and providing commentary on what freight market experts want to know about the industry in real time.
The FreightWaves data science and product teams are releasing new data sets each week and enhancing the client experience.
To request a SONAR demo, click here.