

Chart of the Week: Outbound Tender Rejection Index – USA Seasonality View SONAR: OTRI.USA
The Outbound Tender Rejection Index (OTRI) pushed above 16% for the second time in 2020 last week, after being as low as 2.5% in early May, which was the lowest value seen since the index was created in March 2018. To put it in perspective, the highest value recorded for the national index that measures the rate at which carriers reject their electronic load requests from shippers was 26.8% in March 2018 when carriers were taking advantage of an overheated spot market. What are the odds we reach similar levels in 2020?
When the initial shutdown of the nation’s economy began in March, daily freight volumes surged to all-time highs, with the Outbound Tender Volume Index (OTVI) topping 13,000 for the first time in its two-year history, and tender rejection rates were higher than in all of 2019, exceeding 19%. No one anticipated volumes and subsequently rejection rates would return to something resembling the panic-induced shipping spree in March.
The two indices support the V-shaped recovery theory that states the economy will recover as quickly as it fell. The problem with this comparison is that the recovery looks more like an N than a V. Looking at the OTRI chart, there appears to be a gravitational pull around a 5%-6% value. This does appear to be as close as possible to what one can call a normal market value over the past two years. When conditions are stable — no holiday influence or volume spikes — carriers accept around 95% of their load tenders.
The idea of a normal market is somewhat laughable at this point, but this figure is probably as close to a baseline as we can get considering the economy and supply chains will not have a chance to stabilize until a consistent solution to handling COVID-19 is present. This means that a 20% rejection rate is not out of the question, but neither is a 3% if a second shutdown occurs.
In the near term, there are many positive signs of economic recovery, with the jobs report showing continued progress. The unemployment rate fell to 11.1% in June, which was far better than expectations but still extremely high.
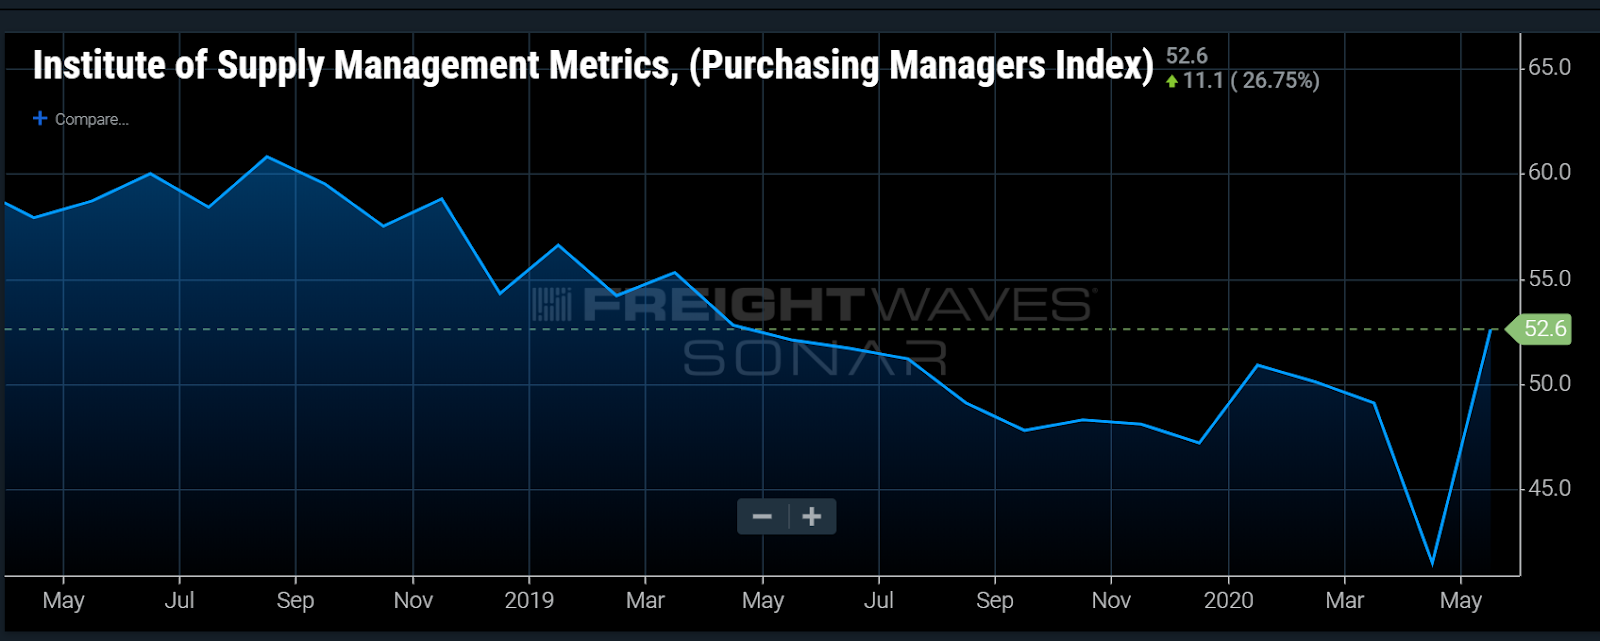
The Purchasing Managers Index (PMI) issued by the Institute for Supply Chain Management, which is used for gauging manufacturing activity in the United States, increased from a historic low of 43.1 in May to 52.6 in June. This is the highest value since May 2019.
Some of the traditional relationships between macroeconomic indicators and trucking have been broken over the past quarter. Many of these indicators do not have a direct relationship to freight volumes, at least in near time. Over the long run, manufacturing volumes and freight have a strong relationship, but the current environment is more like a restart than an established economy.
There are changes in demand that influence the normal flow of order fulfillment and inventory management cycles. Consumers are purchasing different items than they were six months ago due to significant lifestyle changes. Businesses are trying to get in front of these changing behaviors by moving inventory and trying to find their place in the post-COVID world.
The world has changed rapidly, which causes shippers to change rapidly. This means orders will surge and recede rapidly as well, which should ripple throughout the freight market into 2021.
About the Chart of the Week
The FreightWaves Chart of the Week is a chart selection from SONAR that provides an interesting data point to describe the state of the freight markets. A chart is chosen from thousands of potential charts on SONAR to help participants visualize the freight market in real time. Each week a Market Expert will post a chart, along with commentary, live on the front page. After that, the Chart of the Week will be archived on FreightWaves.com for future reference.
SONAR aggregates data from hundreds of sources, presenting the data in charts and maps and providing commentary on what freight market experts want to know about the industry in real time.
The FreightWaves data science and product teams are releasing new data sets each week and enhancing the client experience.
To request a SONAR demo, click here.
Hans Witt
I question this whole ” tender” concept
1- where do they get their information? Load boards
2- fright wave has idea how freight negotiation really works, how can quantify ” un hauled freight” ?
3- carrier reject 1000’s load every day, load offers are not “opportunities” for work unless they are beneficial to the carrier. Shippers and brokers post 1000’s of fake load all the time, drive rates down, or to force contract carrier to haul it. Commodities shippers post loads low ball rates hoping to compete with other markets, if a cheap truck doses not take the load, the commodity is never sold, was the load really there? tender rejection of this type for freight is irrelevant as far the freight market is concerned.
I ask again where do they get their info, when majority freight negations are confidential ?
If they using load board, pirated logistic soft-ware info, and factoring companies, then they using very erroneous sources, from a narrow window.
Hans Witt
Capacity was so tight, why are the rates the same as they were 10-15 years ago? Oh and why hasn’t diesel fuel went up, even when major pipe is shut down.
Stephen Webster
Because of wage subsidy of medium to large trucking companies in the U S and Canada especially on cross border freight. Any trucking company getting a wage subsidy in one Country is getting an illegal subsidy under the free trade agreement. A number of people represent owner ops are pushing to have any Trucking companies getting wage subsidy in Canada barred taking freight into the U S for 100 days after cashing the check of the subsidy are used for truck drivers wages
Steve
Stop all wage subsidy to truck drivers now. Assistance with insurance costs of a limitation of one million dollars per company over a 12 months . Limited assistance to 75 percent of insurance costs or one million dollars whichever is less for truck taxi and bus companies. Many larger trucking companies are using the government money to push out small trucking companies and buy their assets at discount. This hurts shippers in the long run and force many people to other jobs. Those unable to other jobs or unable to keep up to demands of the larger trucking companies will be in the homeless shelter system like in Ontario Canada. 5195239586