A new batch of features and data sets were added to the FreightWaves SONAR freight market data platform over the weekend, including a host of air cargo data. One of the most useful new features is the ability to display historical forward curves.
Simply put, a forward curve of Trucking Freight Futures contracts shows the futures market’s expectations for rates going forward. The contracts are monthly and stretch 16 months into the future, so traders have the ability to buy or sell contracts for the current month (called the ‘spot’ month in futures lingo), and each month going forward. Once data is gathered for the physical market over the course of that month and averaged, the traders who have bought and sold contracts for that month will see money flow in or out of their accounts.
It’s important to remember a forward curve like the one displayed below, for dry van spot rates from Chicago to Atlanta (FWD.VCA), show the market’s expectations at a particular point in time – today.

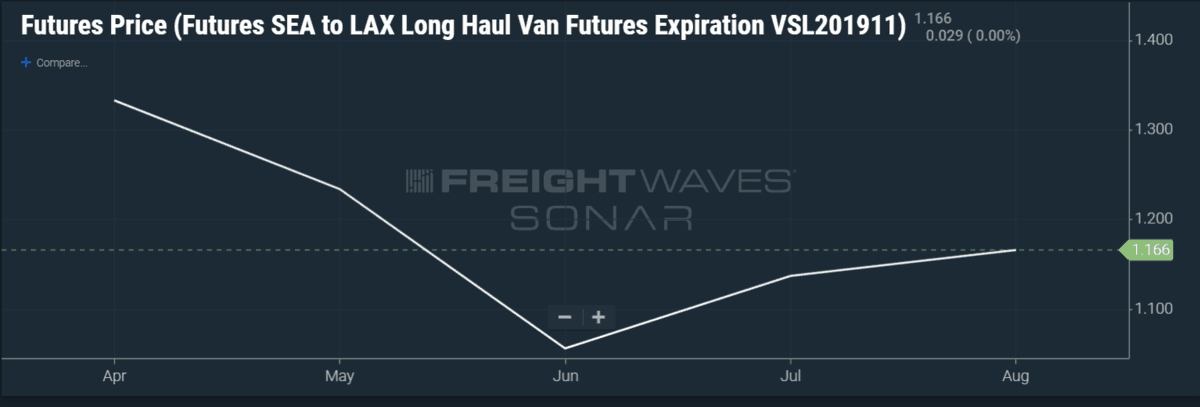
SONAR subscribers can also display the history of prices for a particular contract – for instance the Seattle to Los Angeles contract for November 2019 (FUT.VSL201911). That will show how the market’s expectations for prices on that particular lane and that particular month have changed over time.

In that chart we can see that the market reached its most pessimistic point in June, expecting Seattle to Los Angeles rates for November to be just $1.05/mile. The most recent market consensus, however, has the lane at $1.16/mile in November.
But what was missing was the ability to display the entire forward curve for a lane – the prices for all the contracts – at different points in time. In other words, it was difficult to see how market sentiment changed for the entire 16-month period that futures contracts are traded for. That has now changed, and SONAR subscribers can display today’s forward curve for a lane as well as the one-day-ago curve, and the curves from seven days prior, 30 days prior, and 90 days prior.
The chart below displays historical forward curves for the Los Angeles to Dallas lane (FWD.VLD):

Comparing the forward curves tells a great deal about how market sentiment has evolved in the past three months. First, the market revised its expectations for the fourth quarter 2019 peak and pulled it forward. Secondly, it can be seen that after a period of optimism – the seven-day ago curve shows slightly higher rates than the 30-day curve – the futures market downshifted its expectations for rates. The one-day old curve, the orange line, is the lowest of them all.
At this point, then, slightly bearish sentiment is dragging down expectations little by little. Going forward, users will be able to gauge how the futures market reacts to macroeconomic data, volume reports from container ports and railroads, as well as movements in truckload volume.


Penny
PENNYMARKLOANSERVICES Limited is a private loan Company, that gives life time opportunity loans. Do you need a loan urgently to pay off your debts or you need a loan to enhance your business? You have been rejected by banks and other financial institutions? Do you need a consolidation loan or mortgage? looking for more, because we are here to make all your financial problems a thing of the past.
We lend funds to individuals in need of financial assistance, that have a bad credit or in need of money to pay bills, to invest on business at a rate of 3%. We want to use this medium to inform you that we provide a reliable beneficiary assistance and will be willing to offer a loan. So contact us today by email at:pennymarkloanservices@gmail.com or via whatsapp +1(559)3320134