In the Chart of the Week, we take a look at fourth-quarter transportation earnings and dissect the underlying trends and takeaways. Overall, it was a rough quarter for nearly all transportation companies as the effects of continued excess capacity, an industrial recession, the trade war with China and stubbornly high cost inflation (primarily in wages and insurance) wreaked havoc on reported results. That being said, many transportation executives are hopeful of better times ahead, especially in the second half of 2020.
We aggregated publicly traded companies from truckload, brokerage, LTL, rail and intermodal and compared their results across revenue, operating income, operating ratios (ORs) and earnings per share (EPS) to decipher any under- or outperformance in the quarter.
Truckload results were ugly, but broad-based optimism brewing for improvement in 2020
On average, publicly traded truckload revenues were down 3.9% on a year-over-year basis (worse on a size-weighted basis), operating income was down 57%, operating ratios were up 5.6% to 93.7% and earnings were down 59%.
Standout performers include Marten Transport (MRTN), with revenues rising 6.5% year-on-year, while it was able to hold earnings per share flat. We believe this is due to its outsized presence in reefer, in which trends were far stronger in the quarter. The other notable strong performance came from Werner (WERN), with revenues only falling 3.8% and earnings per share only 9.1% thanks to its industry-best OR of 87.6%.
“A third of the truckload group either lost money or made 1% or less last quarter,” Werner CEO Derek Leathers pointed out at this week’s Stifel Transportation & Logistics Conference. “So if one-third of the publicly traded group is in that kind of shape, imagine what small to midsize carriers across America look like today.”

SONAR: OPRAT.VCFOO, OPRAT.RCFOO, OPRAT.FCFOO
Nearly all truckload carriers reported pressure from insurance inflation and nuclear verdicts. Carriers could start to see relief from a widening wholesale-retail diesel price spread as Zach Strickland wrote about last week (approximately 20% of revenue is spent on fuel by carriers on average).
Brokerage performed as bad as asset-heavy truckload, with competition starting to weigh
In brokerage, we witnessed the average publicly traded broker’s revenue fall more than 13% year-over-year, driven by a 3.6% drop in load volumes and a 10.9% fall in revenue per load. This result was significantly worse than our estimate for how the brokerage market performed as a whole (we estimate industry revenues of between -6% and +1% depending on the contract revenue base), likely driven by increasing competition from digital and other upstart brokers.
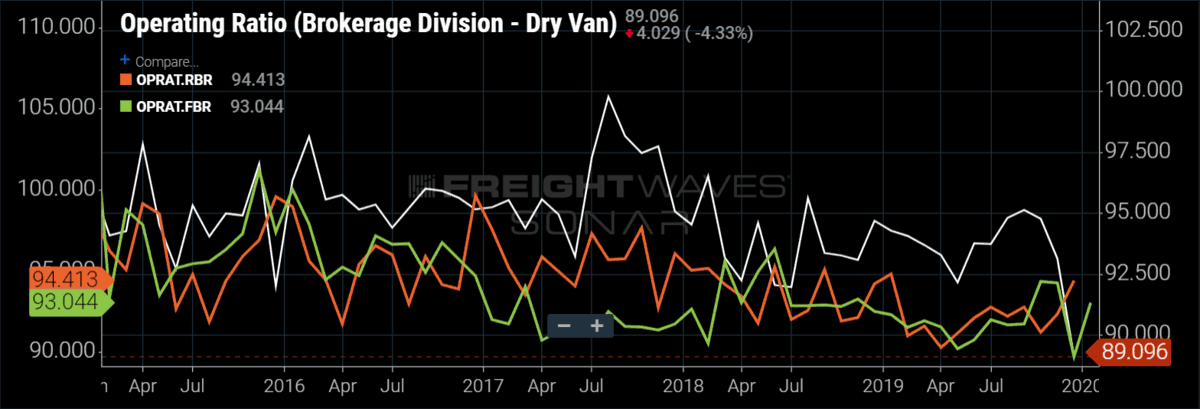
Gross margins for the publicly traded brokers fell 266 basis points (bps) year-over-year, completely opposite of what we would have predicted given spot rates fell 12.9% year-over-year in the fourth quarter, more than three times faster than contract rates (-3.7% year-over-year). Operating incomes fell by 54% on average, with operating ratios hovering around 90% compared to nearly 100% for truckload (see charts above and below).
Some freight brokers performed better than others, with J.B. Hunt leading the way on revenue growth (9% year-over-year) and being the only publicly traded broker to win market share. However, that share gain came at the expense of gross margins, which fell 630 bps year-over-year to 10.6% and resulted in a $12 million operating loss (compared to a $16 million operating profit in the fourth quarter of 2018). Landstar performed best on gross margins (up 70 bps year-over-year to 15.1%) but that stellar result came alongside a 21% drop in revenue. XPO was the standout performer on EPS, which grew 56% year-over-year on an adjusted basis largely thanks to buybacks of 25% of the share count over the past year. XPO also posted the highest absolute gross margins at 17.9%, 380 bps ahead of the publicly traded broker average of 14.1% in the fourth quarter.

LTL saw the largest earnings declines
On average, publicly traded LTL carriers saw revenues contract by 7.2%, operating income by 61.0% and earnings by 87.8%. Results were skewed to the downside by Arcbest (ARCB) and YRC (YRCW). Old Dominion (ODFL) performed best overall as revenues fell just 1.7% and earnings per share by only 7.7% thanks to a best-in-class OR of 81.3%. Saia (SAIA) led the way on revenue growth with 8.9%.
Rail and intermodal performed the best but that’s not saying much
On average, revenue at the rails was down 3.8%, operating income was down 10.7% and earnings were only down 6.2% as ORs held nearly steady at 61.5% due to precision scheduled railroading (PSR). Kansas City Southern (KSU) was the best performer on revenue, while Canadian Pacific (CP) was the best on EPS.
All of the rails performed fairly well in the fourth quarter with continued progress on ORs in a tough environment. The rails are expecting modest volume growth in 2020 after being down 5% in 2019.
In intermodal, J.B. Hunt posted flat revenue and a 16% drop in operating income, while Hub Group (HUBG) saw a 9% decline in revenue and its overall operating income (intermodal segment profitability not disclosed) fell by 19%. Intermodal is a tale of two halves, with the first half of 2020 likely to be mediocre, driven by pricing pressure, while the second half has scope for improvement as the trucking market firms and could spill over into intermodal.
Conclusion
On average, across all of publicly traded North American surface transportation, the fourth quarter saw average revenue declines of 4.5% and earnings-per-share declines of 39%, a reflection of the inherent deleverage in these business models. This contrasted with real GDP growth of 2.1% in the fourth quarter. It was a fitting end to a tough year, but 2020 appears to have better things in store.


