The highlights from Tuesday’s SONAR reports. For more information on SONAR — the fastest freight-forecasting platform in the industry — or to request a demo, click here. Also, be sure to check out the latest SONAR update, TRAC — the freshest spot rate data in the industry.

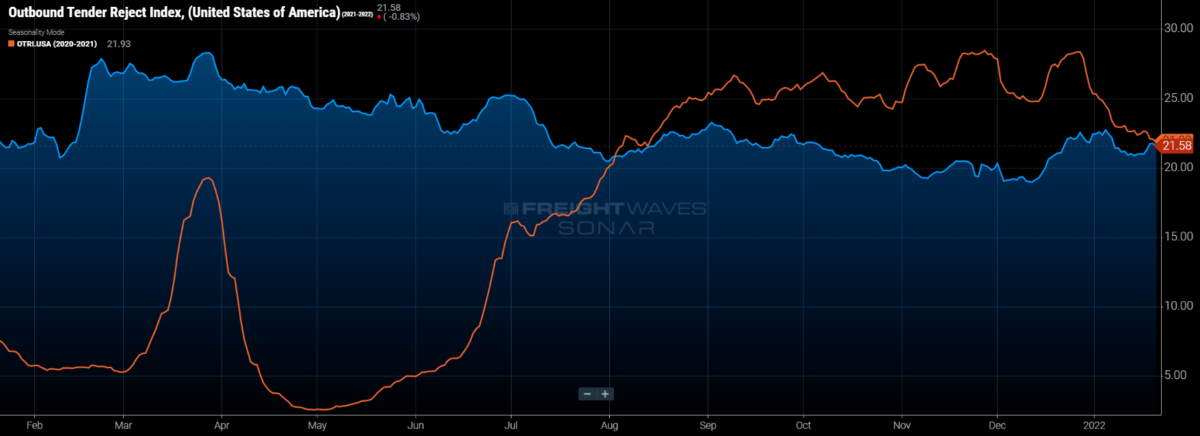
National rejection rates continued to converge with last year’s values as they edged slightly higher to 21.6% by the end of the week.
Even small increases in the Outbound Tender Rejection Index (OTRI) have significant meaning in January because this is traditionally the slow period for shipping freight.
Not only has capacity not grown nearly enough to handle the current demand, but the imbalance of freight flow has also contributed to the capacity shortage.
Northeastern regional rejection rates have increased to start the year, while West Coast rejection rates have declined. Rate disparity between the coasts is certainly playing a role, but it is still a surprising development considering the oversupplied nature of the northeastern markets.
It has become nearly impossible to predict what may happen next; however, we do not expect any wild swings or strong directional changes this week.
Watch: Shipper Update
Lane to watch: Kansas City (Mo.) to Detroit
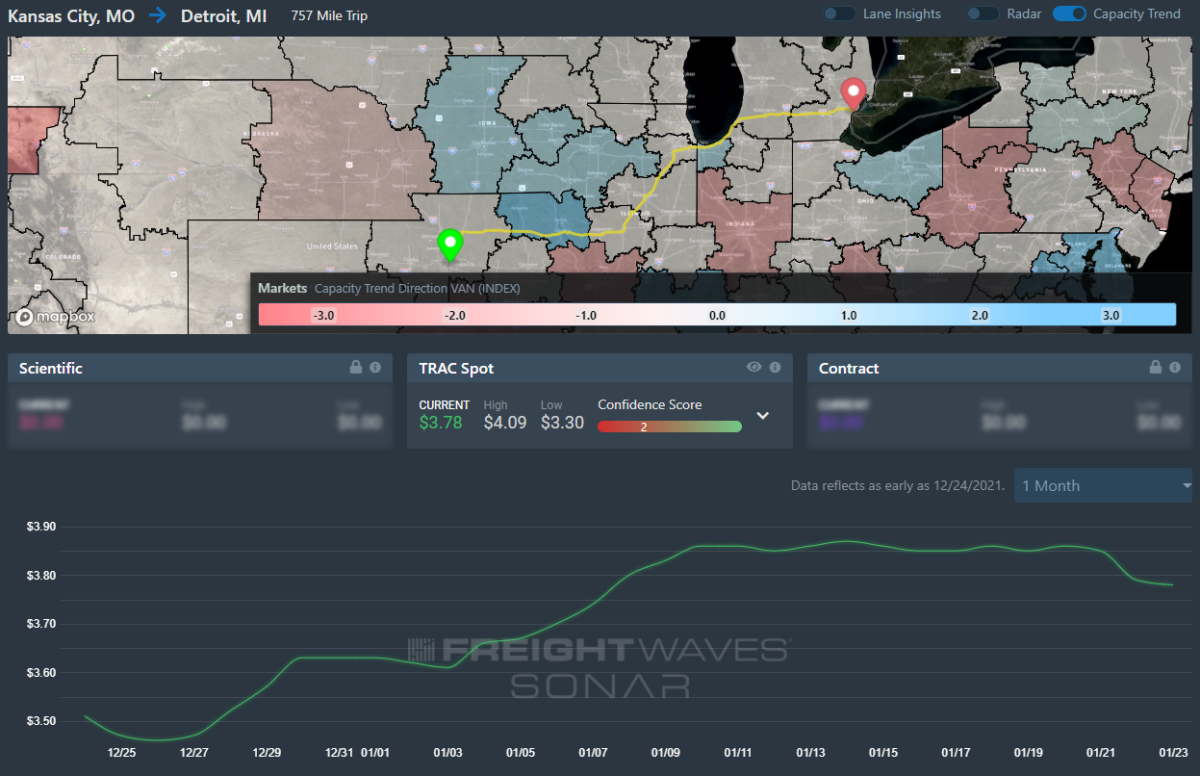
Overview: Volumes are up, but inbound loads still reign supreme in both markets.
Highlights:
- Outbound volume levels in Kansas City have decreased slightly from last week. Rejections have jumped to 30%.
- The Headhaul index has decreased to -14%, meaning the inbound freight volumes are higher than outbound.
- Rejections in Detroit are hovering at 13%. Contract rates should be mostly comparable to the spot market.
What does this mean for you?
Brokers: The Detroit market will continue to tighten as border issues continue. Take advantage of outbound loads in Kansas City and work to get the carrier on the lower range closer to $3.30 per mile.
Carriers: Hold the line on rates. Both Kansas City and Detroit have more inbound loads than outbound. If you have drivers that can cross the border into Canada you have an advantage. Hold the high end of the range at $4.09 per mile.
Shippers: Shippers in both Kansas City and Detroit have tender lead times at 3 days. Keep your shipments at a minimum of 3 days if you can, and go out to 4 days if you want slightly lower rates.
Watch: Carrier Update
Lane to watch: Chicago to Elizabeth (N.J.)
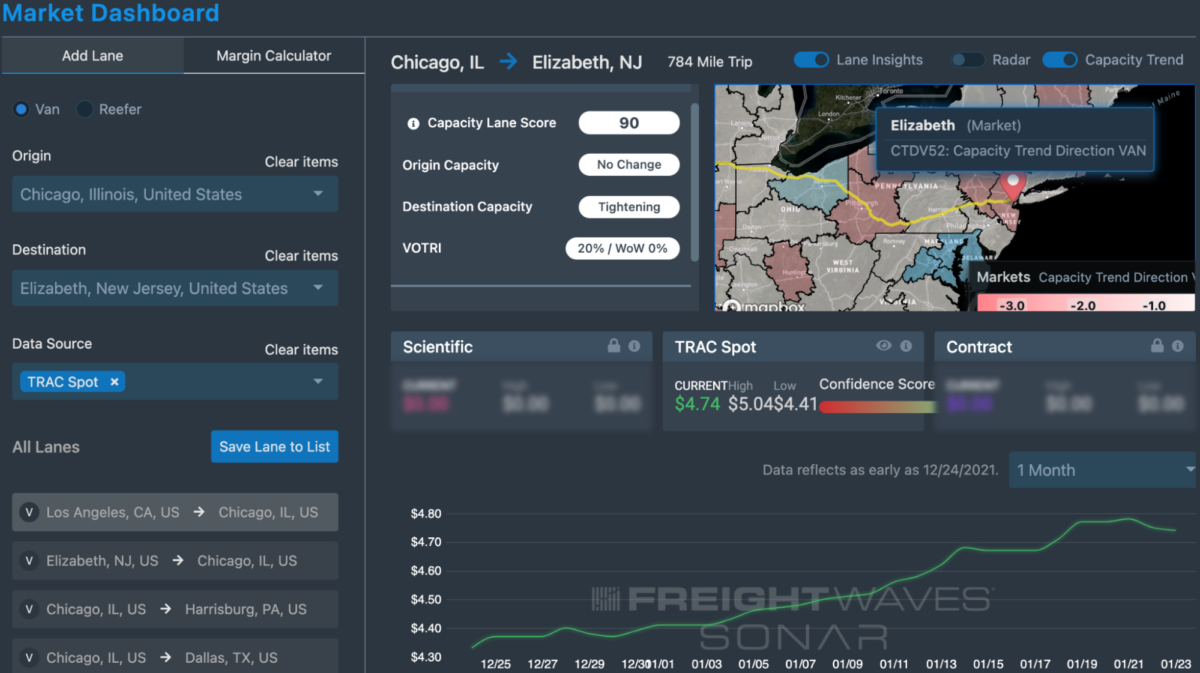
Overview: Van spot rates rise 9.5% month-over-month.
Highlights:
- The latest average dry van spot rate that brokers are paying for capacity is $4.74/mile, including fuel surcharges. This is nearly the highest rate in the past month, and up from $4.33/mile at the end of last year.
- Carriers are rejecting 18.9% of dry van tenders in the lane, compared to 17.8% of all Chicago outbound van tenders and 17.3% of all inbound Elizabeth tenders.
- The intermodal spot rate in the lane is $3.35/mile, including fuel surcharges, which is 29% below the latest dry van spot rate in the lane.
What does this mean for you?
Brokers: Raise your rates to preserve margins amid rising purchased transportation costs. When bidding for capacity, keep in mind that $4.74 is the average per mile rate that brokers are paying for capacity, including fuel surcharges, with $5.04/mile and $4.41/mile representing rates in the 67th and 33rd percentiles.
Carriers: This is currently a solid lane for carriers that will take them to another headhaul market (the Elizabeth Van Headhaul Index is 57, which suggests it should be easy for carriers to get reloaded). Shippers that are utilizing the highway in this lane are likely moving loads that are too time-sensitive or service-sensitive to use domestic rail intermodal, so be sure to get compensated accordingly.
Shippers: While the van tender rejection rate in the lane is well off its high and below the 20.2% national van tender rejection rate, capacity is still tightening in the lane as evidenced by spot rates in the lane that continue to hit new highs). For loads not suitable for rail intermodal, keep lead times extended past the 2.6-day average for all outbound Chicago loads to help secure capacity and keep loads out of the truckload spot market.
Lane to watch: Harrisburg (Pa.) to Columbus (Ohio)
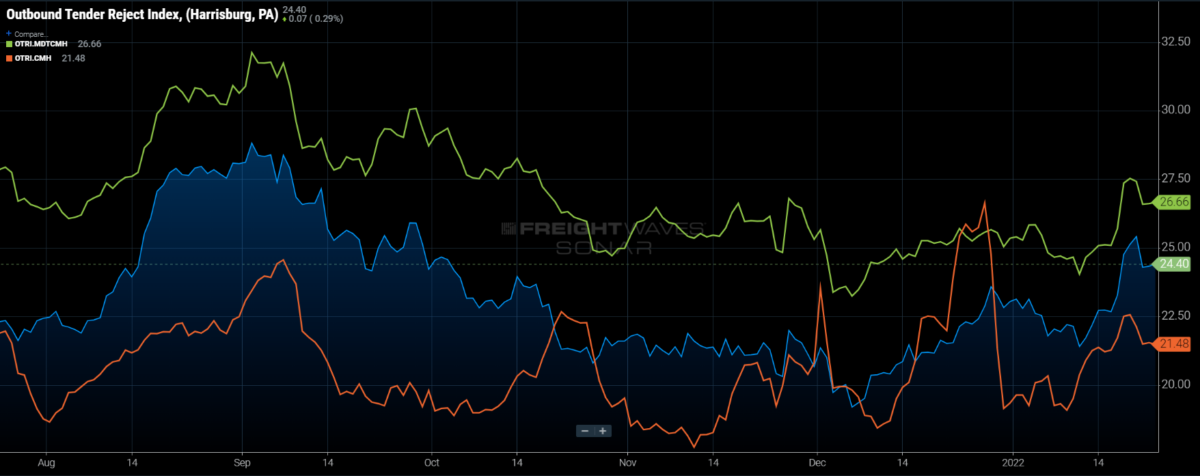
Overview: Harrisburg rejection rates moderate after huge jump.
Highlights:
- Harrisburg’s outbound rejection rate has fallen back after increasing rapidly last week, but remain well above the national average.
- Rejection rates to Columbus are over two percentage points above the Harrisburg average of 24.4% and continue to be among the most rejected lanes out of the market. Spot rates increased nearly 10 cents per mile to $3.23 last week.
- Columbus’ outbound rejection rate has moderated as well, falling back from over 22% last week, but remains on par with the national average.
What does this mean for you?
Brokers: Expect some easing in this lane, or probably more of a deceleration or deterioration this week as rejection rates pull back off an odd January peak. Capacity is more difficult to source moving along the I-70 and I-80 corridors compared to lanes moving south and west. Expect a wide range of rates in this lane as well; a rate below $3 will be a win.
Carriers: Expect a little less spot market action this week in this lane compared to last week, but still high relative to November/December. Expect the highest level of opportunity in short- to mid-haul moves across the Midwest.
Shippers: Be prepared for lower compliance if your contract moves in this lane are well below $3 per mile. Check with your carriers and keep lead times optimized between 3 to 7 days if this is the case.
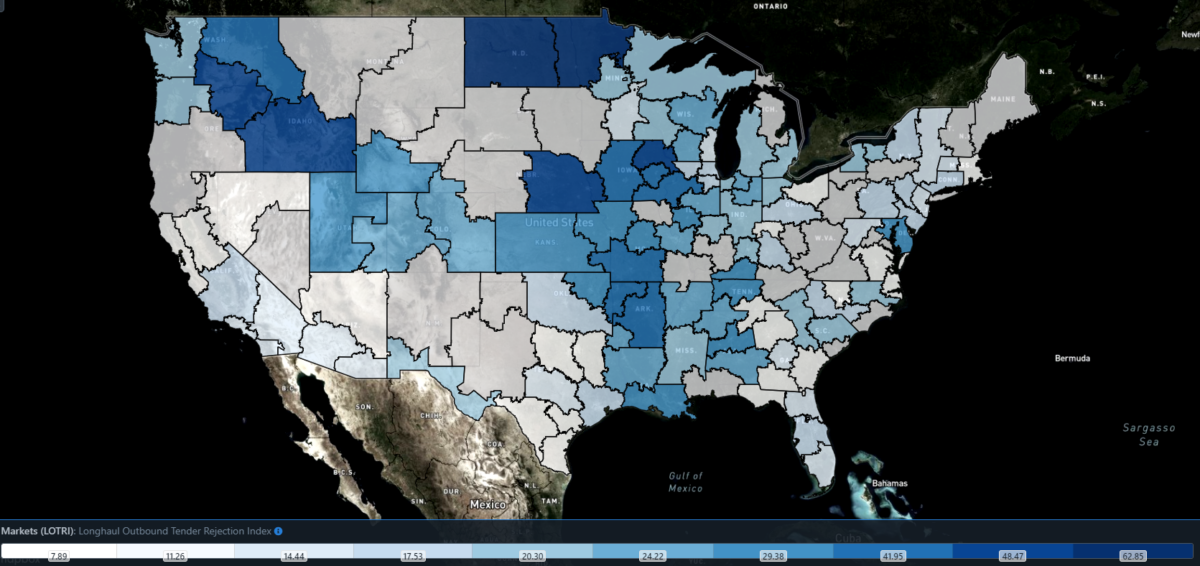
Focus on … Long-haul Outbound Tender Rejection Index
Securing long-haul capacity across the country is quite difficult but even more so throughout the center of the country.
The Long-haul Outbound Tender Rejection Index (LOTRI) signals where long-haul (800+ mile) capacity is the tightest in the country by way of tender rejection rates. The bluer the market in the map below, the tighter relative long-haul capacity is.
Since the beginning of the year, long-haul capacity has returned to the Southern California markets, starving the same capacity from markets in the Northwest over to the center of the country.
The result is long-haul rejection rates in markets like Kansas City still higher than 30% (although the national average is around 21%).