There are encouraging signs that demand is returning to the U.S. trucking market, based on high-frequency truckload volume data from FreightWaves SONAR. Its Outbound Tender Volume Index, or OTVI, measures the volume of truckload tender requests in the North American freight market.
Tender data involves actual load requests from shippers to carriers, so it avoids false signals that are prevalent in load board data (ghost loads and duplicate postings). And since OTVI tracks the contract market, it provides advanced signals of market direction. This is why FreightWaves’ track record of correctly calling early changes in freight market conditions is unrivaled.
On Jan. 25, OTVI registered 10,541, up 12% over the same date in 2020 and 11% above the same date in 2019.

The 2020 number was weaker than the one in 2019 because the freight market experienced a recession in mid-2019 and it was still recovering. At the time, few could imagine how dramatic a change was in store for the freight market a few months later as COVID activity started to impact trucking in the first few days of March 2020. Freight market volume has been disrupted ever since.
While volumes are up, capacity is still greater than demand
If OTVI continues to show progress over the next few weeks, it will demonstrate that the worst is over for the U.S. goods economy, at least as far as volumes are concerned.
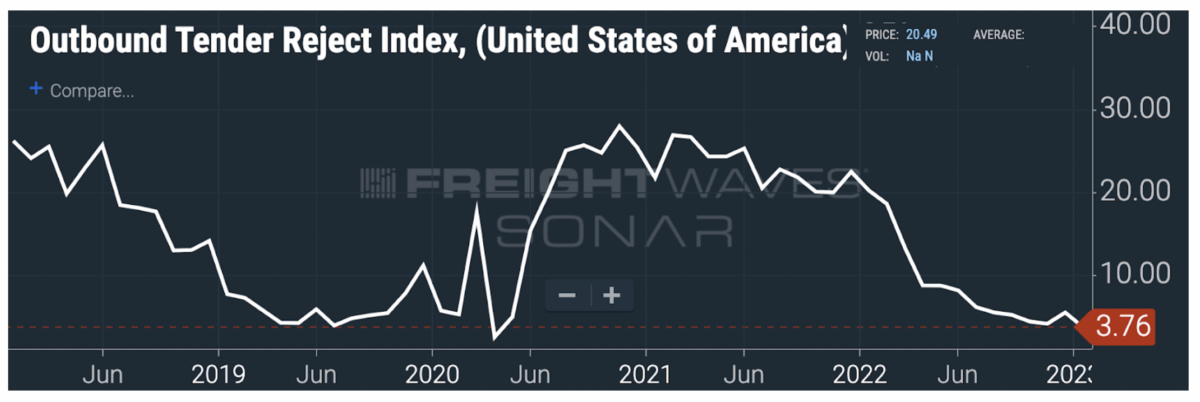
Unfortunately, motor carriers may not see any signs of improvement just yet. One factor that is not currently showing any level of tightening is in the capacity side of the market. SONAR’s Outbound Tender Rejection Index (OTRI) measures the percentage of loads that carriers turn down or reject. OTRI is currently at the lowest point in the history of the index, with the exception of the extreme lockdowns during the earliest days of COVID.

OTRI is currently at 3.76%, a sign that truckload carriers are taking loads almost indiscriminately in the market. They are doing so to keep their trucks moving and their drivers working. Until tender rejections trend above 8% (more than doubling from the current OTRI level), it is unlikely that any carrier will feel signs of optimism about the freight market’s direction.
Supply and demand are currently misaligned
OTVI’s volume indicators are up, while OTRI’s rejection indicators are down. If OTVI and OTRI come from the same data source, why do they suggest two different conditions?
The important thing to remember about freight is that it is a commodity and the market responds to both supply and demand signals.
The demand side reflects freight demand and is measured by OTVI. Volumes will increase when the U.S. goods economy is growing. The recent growth could be because retailers have cleaned out excess inventory and are restocking, or because consumers and businesses are purchasing a greater number of products.
The supply side of the market reflects capacity and is measured by OTRI. Capacity is a reflection of the total amount of dispatchable trucking or intermodal assets in the market. Most increases in capacity are the result of new drivers entering the trucking industry. The pandemic fueled purchases of goods by consumers, and thousands of new drivers and trucks entered the marketplace to meet the increased demand. When demand for goods fell, the result was overcapacity in the trucking market, which caused the severe dip in both spot and contract rates per mile.
If OTRI continues to struggle while OTVI continues to increase, this suggests that the challenges for carriers are reflective of too much capacity. In other words, there are more trucks chasing the current demand for truckload volume in the market.

Truckload spot rates reflect the fact that excess capacity is holding the market down
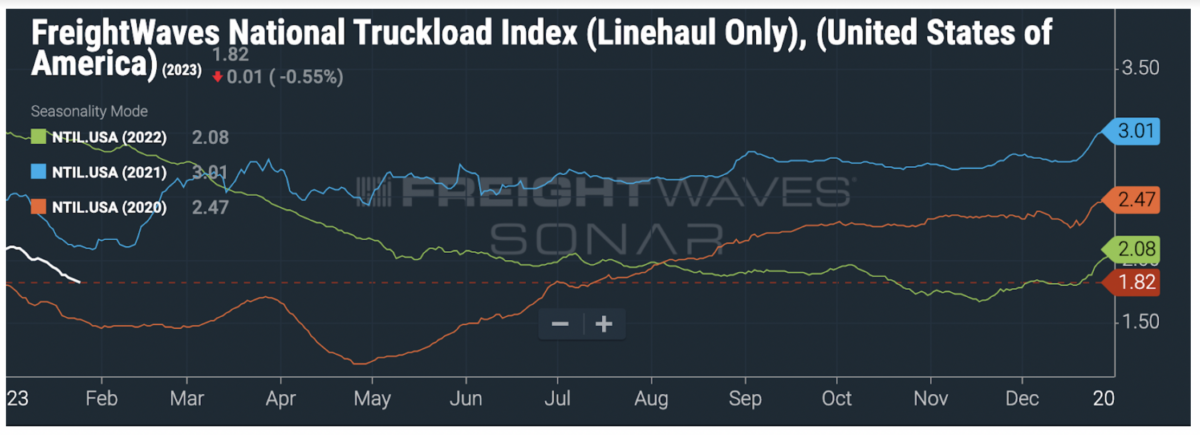
In spite of increasing volume since the start of 2023, truckload spot rates (net of fuel) dropped from $2.02 per mile on Jan. 9 to $1.82 per mile on Jan. 25. While this is certainly above the lowest rate in the current cycle ($1.67 per mile on Nov. 17, 2022), the downward trend isn’t instilling hope for truckload carriers that the market has bottomed yet.
The good news for truckers is if they can hold on for a few more months, stronger volumes from produce and the typical spring shipping season are coming and excess capacity should tighten.
Interested in learning how you can use FreightWaves SONAR’s pricing and high-frequency freight market data for your business? Sign up for a SONAR demo at SONAR.FreightWaves.com.


Anthony Fenner
I have but 2 words to help elevate the problem. Lane Axis!
CFO
The best thing I did in my life I got out of the trucking business Everything was so expensive to maintain – fuel – insurance – registration – no loads – rates were low – waiting at the shipper or receiver long hours or even days. You go to a warehouse they treat you like crap- DOT treat you like crap- you have to be so delicate because you may hurt their feelings and it’s going to cost you money not worth it. My health is even better when I sold my truck lost weight my blood pressure is normal etc.Im unemployed now and my bills are paid now before I was always late. Stay safe drivers.
Don Starr
Hope it starts picking up for the owner operator and others in over regulated California with the mandatory have to have trucks of certain date and up. Shippers have been laying off some employees due to the slowdown..