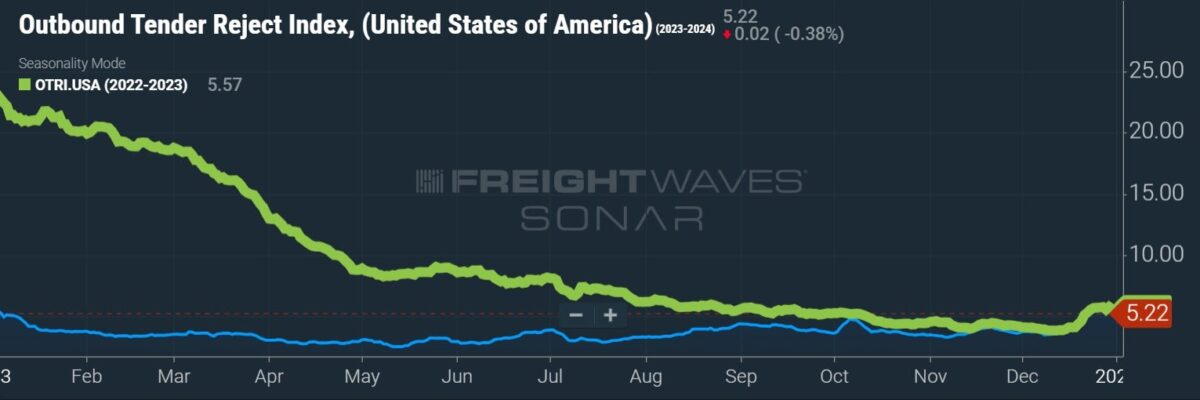
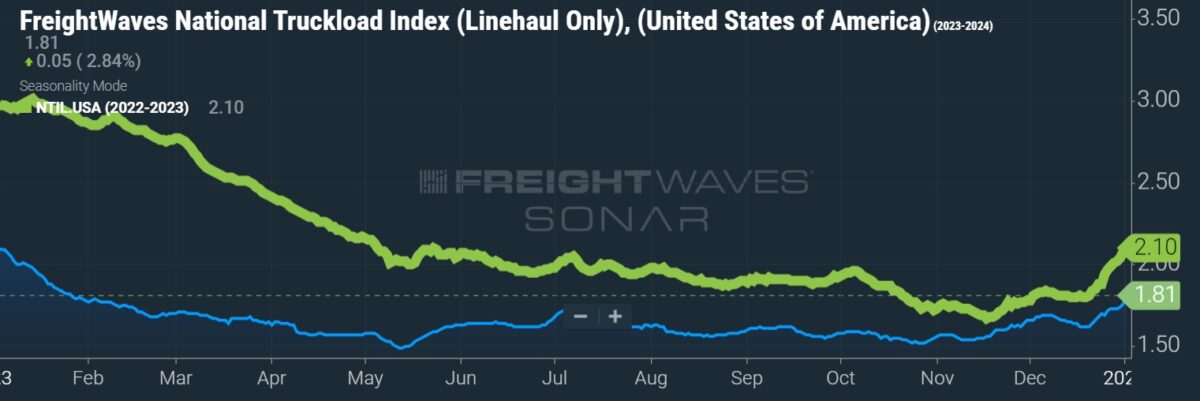
Transportation metrics slid again in December with capacity increasing at a faster pace and prices declining at a higher rate, according to a monthly survey of supply chain executives. However, there was some optimism that the cycle may turn in the new year.
The Logistics Managers’ Index (LMI) registered a 63.3 reading for transportation capacity during the month, which was 1.5 percentage points higher than in November. The LMI is a diffusion index where a reading above 50 indicates expansion while one below 50 signals contraction. The growth rate of transportation capacity was 10 points higher in the second half of the month than it was in the first half.
Transportation utilization (54.6) was 4.6 points higher in the month. The metric was up 8 points in the back half of the month, which the Tuesday report attributed to last-minute holiday-related shipments.
Transportation prices (43.1) declined again, down 1.1 points from November. The pricing index appears to have bottomed in May at 27.9, with the rates of contraction more subdued over the past five months. Lower fuel prices, which result in lower fuel surcharges, were cited as a reason for the decline.
“Fuel prices were one of the major drivers of supply-based inflation over the last two years, a decrease in costs would continue to push inflation down and help to revive the freight sector in 2024,” the report said.
Respondents were asked to predict conditions one year out. The forward-looking expectation for transportation capacity was 51 with prices coming in at 70.3.
“Both numbers would represent a major shift and clear ends to the freight recession that we have been mired in since April of 2022,” the report said.


The overall LMI (50.6) moved backed into expansion territory during December. It has largely hovered around 50 over the past five months with October being the outlier at 56.5.
The move was largely the result of increases in the data set’s warehousing components. Warehousing capacity (55.1) grew at a slower pace in the month as utilization (60.2) increased 7.3 points and prices (65.5) were up 1.3 points.
Warehouse space was tight for retailers, or downstream companies, contracting at a rate of 43.9 compared to an expansion rate of 60.6 for upstream firms at the wholesale and manufacturing levels of the supply chain. Downstream respondents are predicting a surge in warehouse prices (79.7) over the next year.
Inventory levels (44.3) declined at the same pace they did in November. The index has contracted in seven of the past eight months as retailers appear to have returned to just-in-time inventory practices, which props up transportation utilization.
“It will be interesting to see if that changes in the new year or if this is the low point and manufacturers and wholesalers will begin building inventories up again,” the report said.
Downstream respondents returned a neutral response for inventory levels one year from now, but those upstream said they would be growing stockpiles over that time (56.2), which the report said was “the clearest sign yet that retailers are looking to get back to JIT and get off the inventory roller coaster they have been riding over the last few years.”
Inventory costs (55.8) were off 6.3 points during the month and grew at the lowest level ever recorded in the 7-year-old data set. This cost index has never crossed into contraction territory. Inventory costs were 15.9 points higher at the retail level of the supply chain.
Actions deployed post-pandemic to reduce inventories may result in more normal seasonal shipping patterns this year, the report said.
“Inventories have been lean for months, but as we go into 2024 with a year of inventory reduction practices under our belt, it is likely that the normal seasonality that leads to capacity utilization in warehousing — and particularly freight — will return.”
The forward-looking prediction for the overall index was 59.9 in December, 2.5 points higher sequentially and near the data set’s historical average of 62.5.
The LMI is a collaboration among Arizona State University, Colorado State University, Florida Atlantic University, Rutgers University and the University of Nevada, Reno, conducted in conjunction with the Council of Supply Chain Management Professionals.
More FreightWaves articles by Todd Maiden
- 2023’s most notable deals in trucking
- Auction moves 2nd lot of Yellow terminals
- Forward Air sells final-mile unit to Hub Group for $262M


Abduaziz
I don’t know who creates this statistics, but they are 90% wrong!
Don’t waste your time and just call 10 Carriers and ask them how they did compared to last year December and they will all tell you that Gross income were about 30-40% compared to last year!
Daniel B Capua
Sounds like XPO has got it together