Transportation prices grew from depressed levels for a second time in as many months during February, a Tuesday supply chain report showed. However, the rate of growth in transportation capacity was higher, signaling a meaningful recovery in the freight cycle is not yet underway.
The subindex for transportation prices (57.6) increased 1.8 percentage points sequentially in February, according to data compiled in the Logistics Managers’ Index (LMI). Prior to January, the index had been in contraction territory since July 2022.
The LMI is a diffusion index. A reading above 50 indicates expansion while one below 50 signals contraction.
Upstream firms (60.9), like wholesalers and manufacturers, returned a stronger price indication than downstream firms (52.7) like retailers. The overall transportation pricing subindex slowed as February progressed. It registered a 62 in the first two weeks of the month compared to 52.4 in the back half of the month.
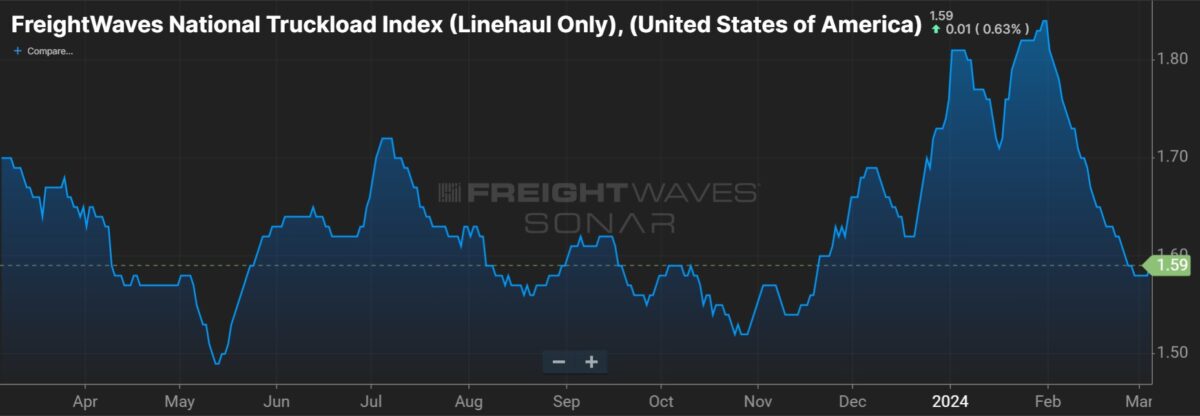
The trend was similar to the spike in truckload spot rates captured by FreightWaves SONAR. Severe winter storms in January forced many carriers to park trucks for several days, reducing overall capacity and providing a temporary lift in rates. The backlog of freight took a couple of weeks to unwind. As it unwound, so did spot rates.
The LMI data also includes transportation rates from other modes, like ocean shipping, where rates have spiked due to the Red Sea conflict, drought conditions at the Panama Canal and the run-up to Lunar New Year.

Transportation capacity (60.9) expanded further, up 6.4 points, as utilization (56.5) stepped 1.5 points higher.
The report said the growth rate in capacity outpacing the growth rate in pricing suggests “we have not yet entered a true growth period in the freight market.” However, an inflection appears to be on the horizon. Survey respondents returned a barely-positive reading of 50.5 for transportation capacity one year from now compared to a more pronounced jump in prices (77.1). The future take on prices was 3.4 points higher than last month’s expectation.
The outlook for transportation equipment utilization (68.3) a year from now was 6.4 points higher sequentially.
The overall LMI moved nearly 1 point higher to 56.5 in February, with all eight subcomponents of the index seeing expansion for a second consecutive month. February was the sixth time in seven months the index has been in expansion territory. However, the reading remained below the 62.4 all-time average for the 7.5-year-old data set.
Inventory levels (58.5) were up 5.7 points from January and have been in growth territory for three of the past five months. The report said this was “a clear sign that firms are restocking after running inventories down over the holidays.” Inventories grew 5 points faster at upstream companies (60.6).
“This is a marked shift for U.S. manufacturers and wholesalers who have been hesitant to increase inventories,” the report stated. “3PLs are also represented in this group, so the increase there may represent higher levels of turnover in general.”
It said retailers have returned to just-in-time inventory strategies but did see stock levels increase as well, returning a 55.6 reading.
The outlook for inventories one year from now was 60.1, which was 1.4 points lower than in January.
“The buildup of Upstream inventories is a positive sign for the logistics industry as it suggests we are now seeing more balance across multiple levels of the supply chain,” the report said.
Inventory costs were down 3.9 points but remained in expansion mode at 62.9.
Rising inventories are keeping warehousing metrics tight.
Warehouse capacity (52.8), remained in expansion territory, but the level of growth declined for a third straight month in February. Utilization (66.3) was 7.6 points higher and “likely reflective of the inventory buildup happening further up the supply chain.” Warehouse prices (64.2) grew by the same amount as they did in January.
Aggregate logistics prices — the sum of inventory costs, warehouse prices and transportation prices — were near a one-year high at 184.8 (150 equals equilibrium), but well off the all-time high of 271.3 that was set two years ago.
The LMI is a collaboration among Arizona State University, Colorado State University, Florida Atlantic University, Rutgers University and the University of Nevada, Reno, conducted in conjunction with the Council of Supply Chain Management Professionals.


Vanessa Williams
Hi Chris,
Thanks for the update, however, if you look at the load boards, it went down. The Brokers are keeping all the money and driving the carriers out of business.
Chris P Bacon
Feb was a decent month for my company but March is already atrocious!