Tender rejection data in the FreightWaves SONAR data platform shows that the freight market bottomed on May 14. Since then, conditions for carriers have slowly been improving.
SONAR’s outbound tender rejection index (OTRI) tracks the balance of supply and demand in trucking by measuring the percentage of truckload freight that is rejected. In trucking, supply equates to the number of trucks available in a market for dispatch, while demand is the number of loads tendered in that market.
OTRI data comes from the “tender” messages between shippers and motor carriers. Tender messages are requests for truckload capacity by shippers in the contract freight market. A tender rejection by a carrier tells a shipper that the carrier has another option for that truck (or trucks). Higher rejection rates mean that the supply/demand balance is swinging in favor of trucking fleets.
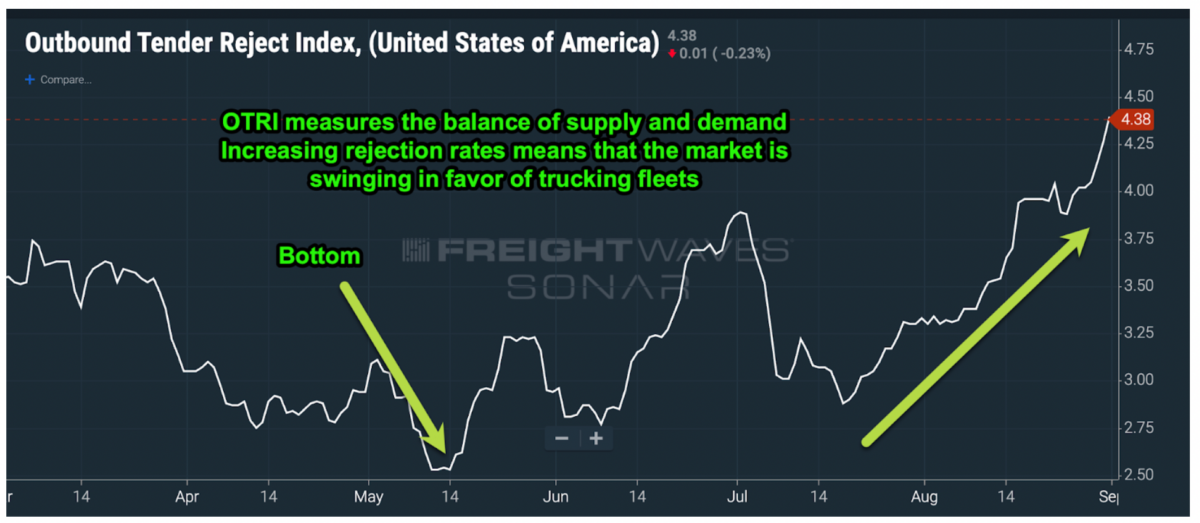
Current tender rejection data signals a stronger quarter year over year (y/y) for motor carriers. Tender rejections are on pace to surpass last year’s number and should do so by the end of the third quarter.
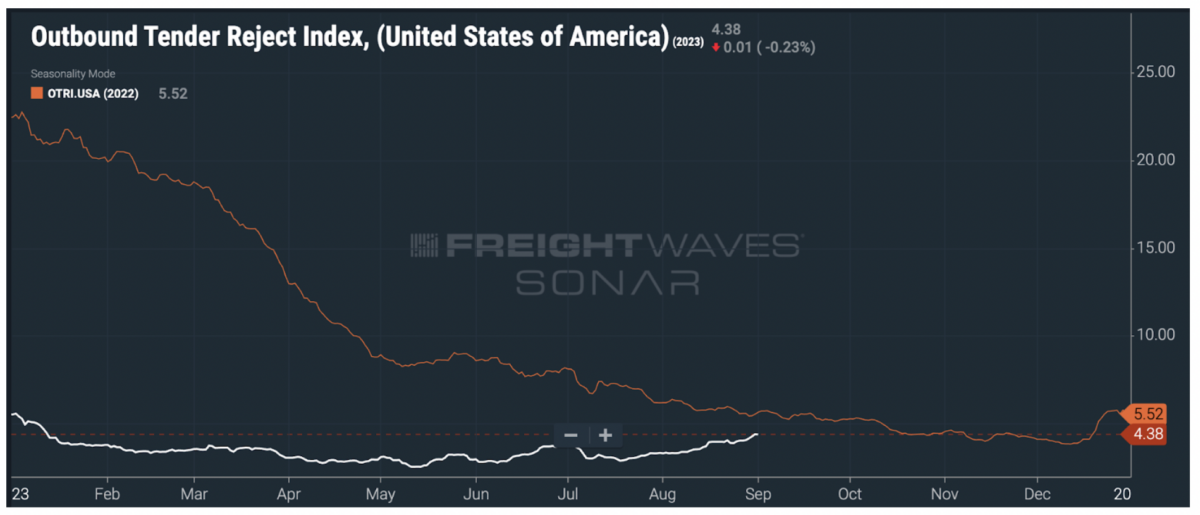
Tender rejections are also signaling that the current market is similar to 2019. (Orange in this chart is 2019.)
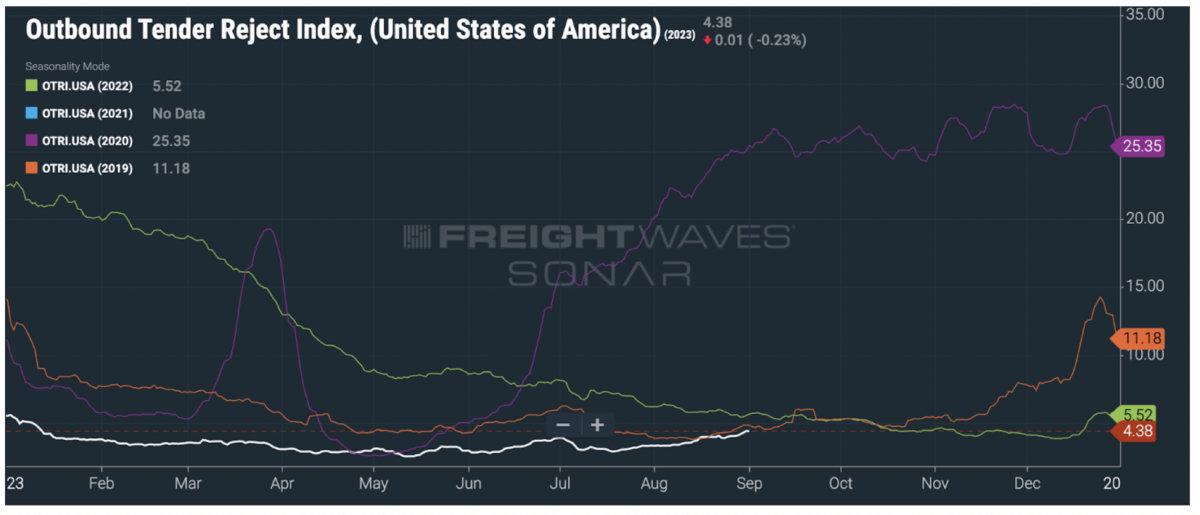
Who wins?
The Waterfall Theory of Freight suggests the largest carriers are the last to be impacted by a slowdown and the first to see the market come back. The Waterfall Theory of Freight is the foundational theory that tender rejection data is designed to monitor.
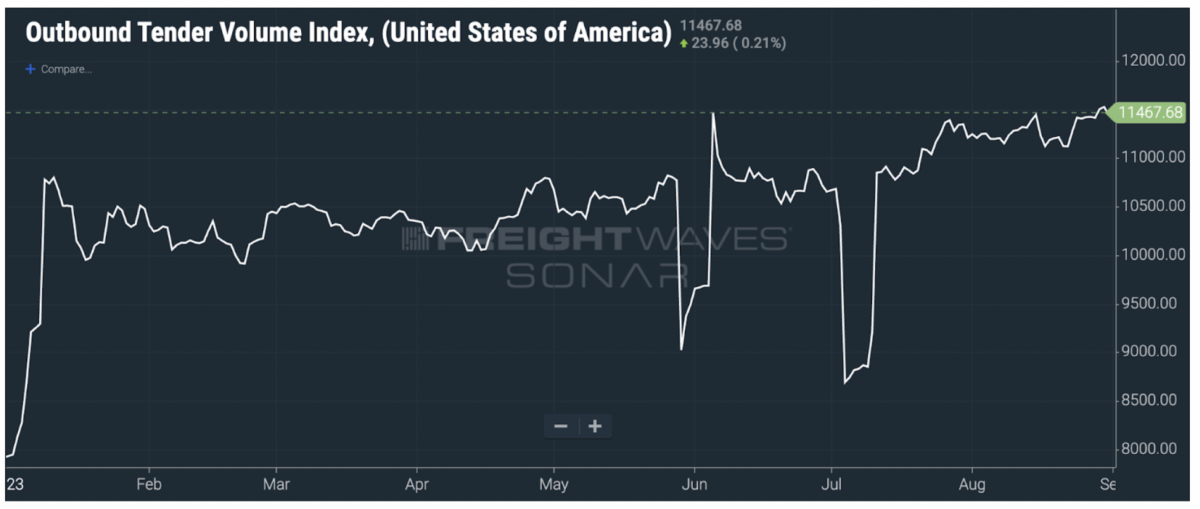
As shown in the SONAR chart above, volumes have continued to strengthen throughout the year. This suggests that the trucking market could see a decent peak season, providing some relief for motor carriers.
Even though conditions are improving, there is still over-capacity in the marketplace (too many trucks chasing too little freight). This situation will continue to correct itself over the next several months.
The chart below shows the number of net additions of trucking firms in the market (meaning it measures revocations of operating authority compared with newly established trucking companies). The chart is measuring the market in weeks; green is expansion, red is contraction.
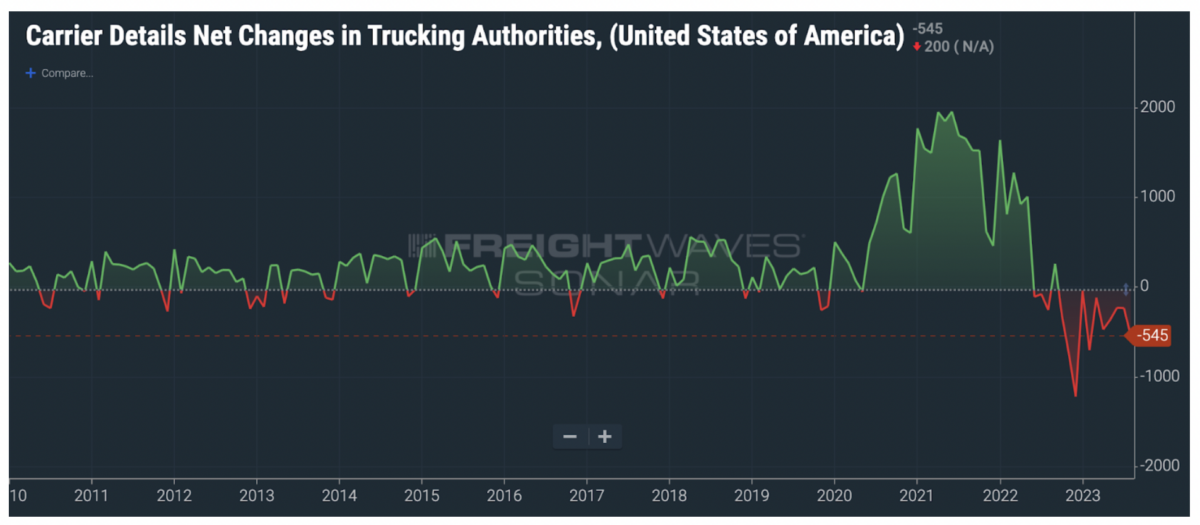
As capacity continues to correct, the freight rate cycle will begin to move at a faster pace (perhaps later this year; more likely late in the first quarter of 2024). Rates will move higher. Generally speaking, this helps carriers and is detrimental to shippers.
When capacity has declined sufficiently in the market while volumes have increased to more robust levels, spot rates will increase.
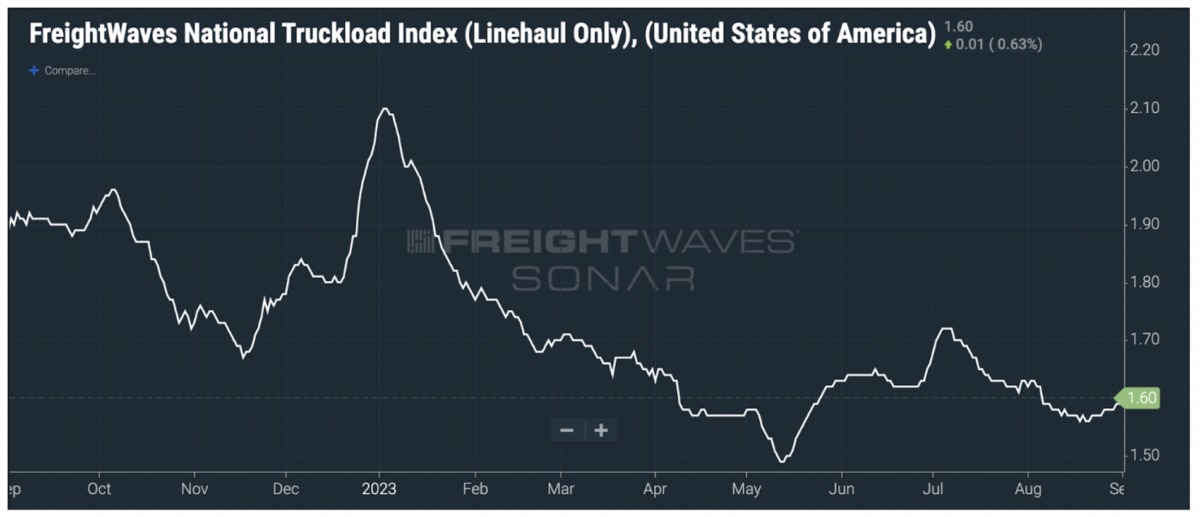
The spread between contract and spot rates
As the freight market comes out of the doldrums, shippers may pay higher prices to ship their freight in 2024. However, the next stage of the freight cycle may be much harder on freight brokerages than shippers. Many shippers have started to prefer asset-based carriers in their routing guides, which has meant lost volume for brokers.
Lower volume means lower revenue for brokers. However, brokers also make their money on the “spread.” – i.e., the delta between contract and spot rates.
The spread is another key measurement that can be found in SONAR.
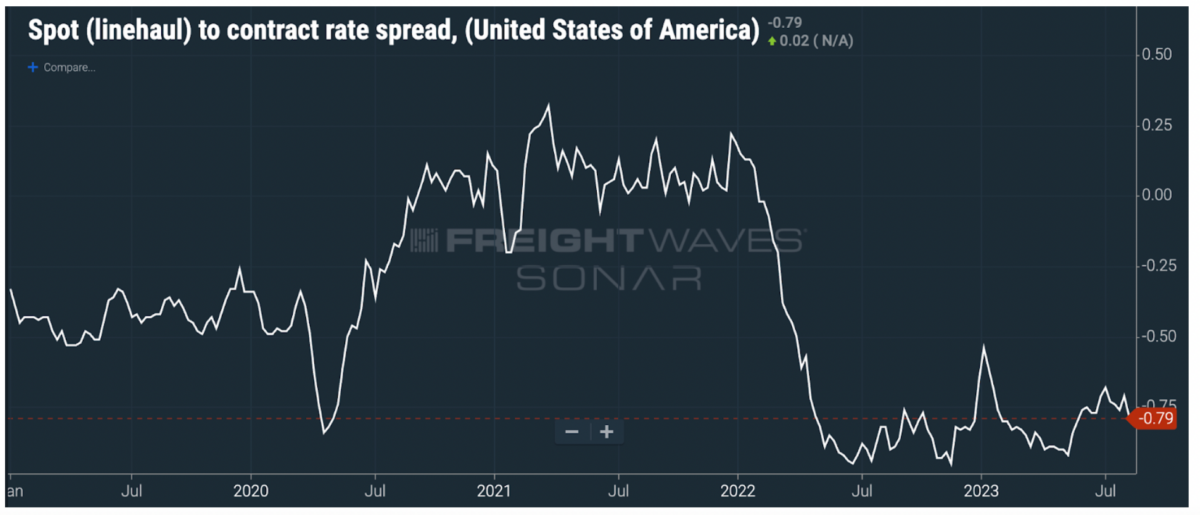
Currently, the spread is -$0.79, meaning it is $0.79 cheaper per mile (net of fuel) to move a truckload of freight using a carrier from the spot market than it is via a contract.
While the spread has narrowed, it is still near record levels.
The spread will tighten further as spot rates increase while contract rates (many renegotiated at lower levels beginning in the spring of 2022) stay near their floor (although contract rates also have likely bottomed).
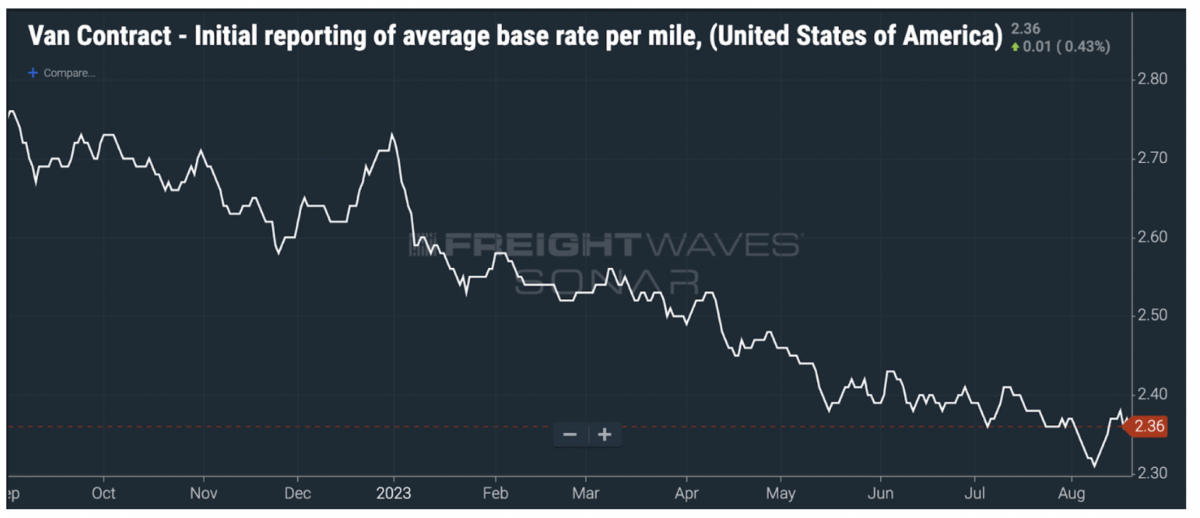
Trouble ahead for brokerages?
This means that freight brokers with freight committed in the contract market will see their margins squeezed.
That could lead to some of the high-growth brokers that financed their growth through debt in a near-0% interest rate environment fail.
These brokers tied their debt covenants to margins and would be in violation of those covenants. This could cause some brokerages to fail, as Surge Transportation did earlier this year.
A digital freight brokerage founded in 2016 by Omar Singh and based in Jacksonville, Florida, Surge Transportation filed for Chapter 11 bankruptcy protection. Of its top 20 creditors, 16 are factoring companies that pay small carriers.
The outlook for 2024
Conditions for carriers could improve dramatically in Q2 2024; and they may have the upper hand in negotiations with shippers at that time.
After more than 18+ tough months for many carriers, they should be preparing for higher volume and rates. They should continue to right-size their businesses, cut costs where possible, and be ready to offer volume and service to current and prospective shipper customers.
What can shippers do as the market begins to turn?
They should prepare now by benchmarking their freight costs against data, locking in contract rates, or using index-linked contracts to manage rate/capacity risk.
FreightWaves is currently working with some two dozen shippers on freight rate indexing to help them prepare for a tighter 2024 bid season.
All of the charts presented are available on SONAR, the high-frequency freight market intelligence platform empowering businesses in the supply chain.
FreightWaves SONAR’s price, demand, and capacity data spans across all modes to allow logistics leaders to benchmark, analyze, monitor, and forecast the global physical economy.
Request a SONAR demonstration here.


Markeesh wilson
Be weary of what freight waves tells you, We are heating up for holidays right now, What happens right after new years, If tender rejection is %4 now there is a high chance that will drop drastically right after new years. Not a big enough gain to deal with the fall after new years. The fall will be alot worse.
First half of 2024 will be a hell hole as all of these carriers will exit the market.
ShipHappens
I like the Surge Transportation call out for sure, but the reason they’re filing for Chapter 11 is because of the fact that their business was solely focused not on contract freight, but spot freight and being back-up in routing guides with a Rating API, had they shifted focus when this was immediately identified – they probably wouldn’t be in this predicament. The model they followed saw volumes dwindle drastically and considering the approach on RFPs there, there was not enough time for them to pivot and take advantage of the spread that most brokers do.
Al-Solo Nyonteh
As a Trucker it is difficult to get information on the direction of the market. The “truck stop talk” is hit or miss. Since, I have been following FreightWaves, they have been spot on. It’s safer to get market information from FreightWaves rather than “Trucker Bob”.