Short-haul freight demand has been much more resilient to the cooling market
Chart of the Week: Shorthaul Outbound Tender Volume Index, City Outbound Tender Volume Index, Lonhaul Outbound Tender Volume Index – California SONAR: SOTVI.CA, COTVI.CA, LOTVI.CA
The AB5 ruling will give supply chains another layer of complexity to deal with just as conditions were starting to show signs of improvement. The reason is that the ruling largely affects regional carriers and shippers that operate in California, where activity has not slowed nearly as much as the national market. According to the short (SOTVI -7% y/y) and local haul (COTVI -18%) tender volume indexes for loads moving less than 250 miles out of California, demand has been much more resilient to the softening market than freight moving longer distances (LOTVI -35%).
The AB5 ruling will have a minimal near-term effect on trucking on a national level, with most of the pain being felt by local carriers and shippers in California that focus their activity around the ports and warehouses. They often employ the services of owner-operators in times of excessive demand.
Even though it appears a slowdown is coming from the import side, the nation’s largest port complex of Long Beach and Los Angeles is still working through a lot of backlogs and containers have piled up in their yards.
Combine that with the fact inventory levels have grown in response to continuous over-ordering, companies will be busy repositioning their goods upstream — largely around the port cities — for a while.
Operating costs in California are among the highest in the nation and most national carriers already account for this by domiciling drivers in lower-cost states. Many regional carriers and local drayage operators cannot avoid this ruling and will have to either hire more drivers or give up supporting their customers fully in times of surging demand to account for the loss of flexibility.
With the Supreme Court making this decision, there is a longer-running concern that other states will adopt this, which is another issue entirely.
The ruling’s intent is to provide more employee protection, but the debate over whether they need it in trucking has been ongoing, especially around drayage, which is what started the ball rolling in the courts.
Trucking is typically a very seasonal operation, with extreme ebbs and flows. You can see that reflected on a national level in the Cass Freight Shipments Index, which measures freight volume based on invoice data. Demand rises and falls by as much as 20% within a year and even more wildly between economic cycles, making it nearly impossible to rightsize fleets from a carrier standpoint.
Hire too many drivers and carriers carry too much cost, putting them at risk for layoffs or failure. Hire too few and carriers are unable to service their customers in times of surging demand and prices inflate as they have over the past two years.
According to FreightWaves contract rate data, trucking base costs excluding fuel have increased nearly 50% since July of 2020 due to demand exceeding capacity.
Carriers in California will have to ponder this decision while shippers may have just been handed another rate increase and another sourcing challenge.
In the long run, this ruling will encourage defragmentation (inflationary) but also potentially erode the driver base (inflationary) as owner-operators who wanted independence leave the industry.
On the other hand, Zac Rogers stated on this week’s Freightonomics episode that the thought of a more stable working environment will attract more drivers (deflationary). Depending on the magnitude of the volatility of demand, either is possible. In the near term, regional California shippers will need to plan on costs staying elevated.

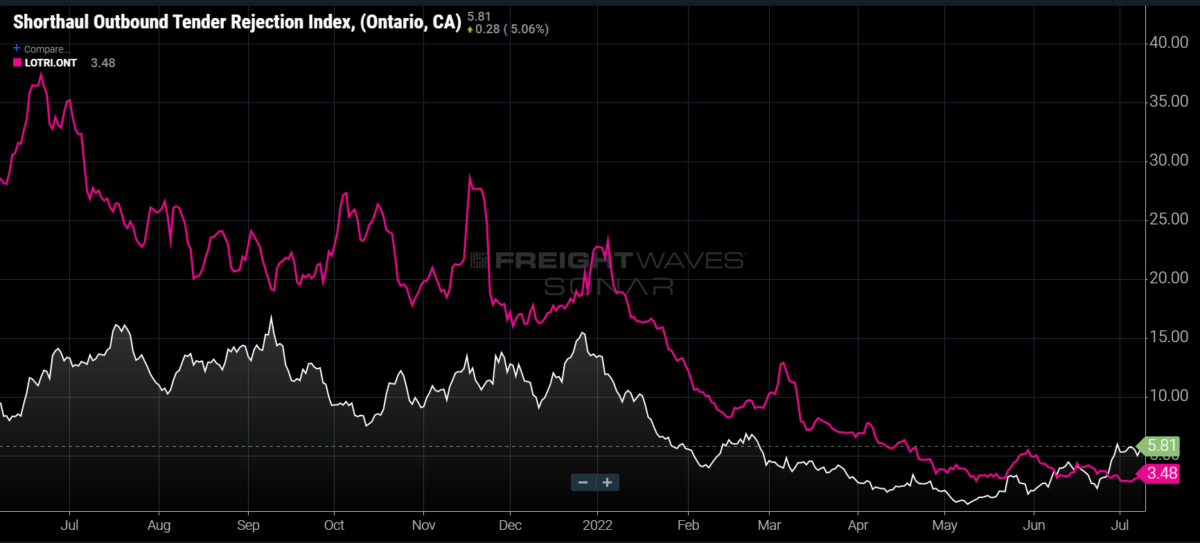
Short haul rejection rates for loads moving between 100 and 250 miles out of the Ontario, California market now exceed those for loads moving more than 800 miles, an extremely rare occurrence whose timing suggests AB5 is already having an impact on the availability of capacity.
About the Chart of the Week
The FreightWaves Chart of the Week is a chart selection from SONAR that provides an interesting data point to describe the state of the freight markets. A chart is chosen from thousands of potential charts on SONAR to help participants visualize the freight market in real time. Each week a Market Expert will post a chart, along with commentary, live on the front page. After that, the Chart of the Week will be archived on FreightWaves.com for future reference.
SONAR aggregates data from hundreds of sources, presenting the data in charts and maps and providing commentary on what freight market experts want to know about the industry in real time.
The FreightWaves data science and product teams are releasing new datasets each week and enhancing the client experience.
To request a SONAR demo, click here.


Stephen
A B 5 was needed to truck drivers end up homeless and injured disabled no proper medical supplies or proper medical care or proper food. The C T A does not look out or care for sick or injured drivers . Ont had many drivers expire in the last 18 months
skillslash academy
Thanks for giving me the opportunity to talk about a Data science course. For a Best career in Data science i recommend the Skillslash is recognized as the best data science institute in Bangalore. We cover all the essential topics in data science like R, Python, Machine Learning, and Deep Learning, Tableau, etc.
https://skillslash.com/data-science-course-in-bangalore/
Skillslash
I like your post. I appreciate your blogs because they are really good. Please go to this website for Data Science training in Bangalore These courses are wonderful for professionals.