Fear of the supply chain crisis is fading. Transport stocks are crashing. Yet an enormous amount of cargo is still flooding into U.S. ports.
On Tuesday, the Port of Los Angeles reported better-than-expected volumes for March — it was the port’s best March ever, the fourth-best month in its history, and it capped the best-ever first quarter.
Total throughput was 958,674 twenty-foot equivalent units, topped only by May 2021, October 2020 and August 2020. First-quarter throughput was 1.8 million TEUs, up 3.5% from last year’s record January-March.
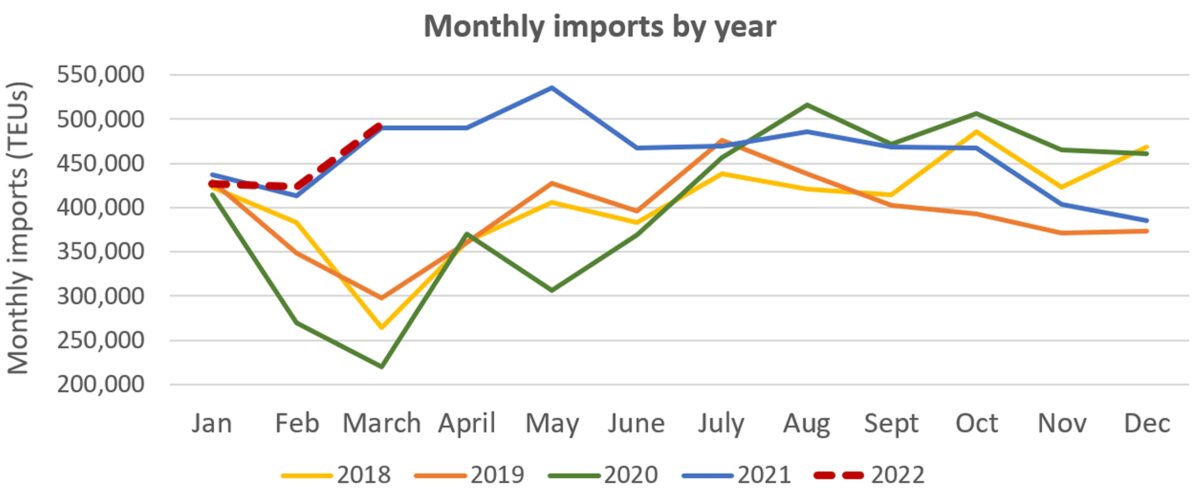
March imports were 495,195 TEUs. As with total throughput, it was the fourth-highest import monthly tally ever and the highest since last May.

Huge gains versus December
The sequential month-on-month surge in imports is particularly telling. March’s imports jumped 17% from February’s. Imports in March were up 29% compared to December, when inbound volumes hit their lowest point since June 2020, a month when America was in the midst of lockdowns.

Rising import volumes normally signal greater supply chain pressure ahead. In this case it may be the opposite.
Record cargo volumes have been stuck waiting in ship queues off U.S. ports. The drop in Los Angeles’ December numbers in the run-up to Christmas was not due to a falloff in demand for import services. Rather, it was due to landslide bottlenecks that prevented more cargo from being offloaded from the queue.
In March, actual volume arriving in California from Asia should be seasonally reduced due to the February Lunar New Year holiday in China. But imports surged as more ships in the queue were offloaded. Between the beginning and end of March, the number of container ships waiting off Los Angeles/Long Beach fell from 60 to 48, or 20%, according to statistics from the Marine Exchange of Southern California.
“Here’s what I think is behind our strong first quarter,” said Port of Los Angeles Executive Director Gene Seroka during Tuesday’s press conference. “First, better fluidity on our docks. We’ve been working at this for a long time and it’s paying off. We have fewer vessels waiting in the queue and more velocity on the terminals. We also have a lot more room to maneuver on the terminal tarmacs.
“Second, we’ve got more workers on the docks, with fewer shifts being cut. That’s because we’re past omicron. And third, we’re using more data than ever.”
Too soon to sound the all-clear
When the final unwinding of the supply chain crunch happens, it should look like an increase in import volume at first (as offshore queues are offloaded), followed by a downturn.
The Port of Los Angeles numbers are following the first part of the pattern, but it could be just a temporary reprieve. Not only are reductions in the West Coast queue slowing, if not reversing, but port congestion on other coasts remains extremely high.
The Los Angeles/Long Beach queue fell to just 33 container ships on April 4. There were 46 container ships waiting on Tuesday, up 39% from that low.

Off East/Gulf Coast ports, ship-position data from MarineTraffic showed continued very high queue levels on Tuesday afternoon. There are 64 container ships waiting in total, with the Charleston, South Carolina, queue at 16, New York/New Jersey 13, Houston 12, Virginia 11, Savannah, Georgia, six, Freeport (Bahamas) three, and one each off Philadelphia, New Orleans and Jacksonville, Florida.
Meanwhile, there is no evidence yet of a significant dropoff in import bookings. FreightWaves has a proprietary index of ocean shipping import bookings to the U.S., measured in TEUs, indexed to January 2019. This index remains at over 200, at around the same level it was this time last year.

Click for more articles by Greg Miller
Related articles:
- Container shipping at the crossroads: The big unwind or party on?
- Retail boss warns on supply chain, likens demand risk to ‘Big Short’
- East Coast ports about to get slammed by a lot more ships
- Is this the calm before California ports’ next cargo storm?
- Supply chain whack-a-mole: West Coast eases, East Coast worsens
- What COVID spike, massive lockdowns mean to shipping
- Different container indexes, vastly different rates. Which is right?


