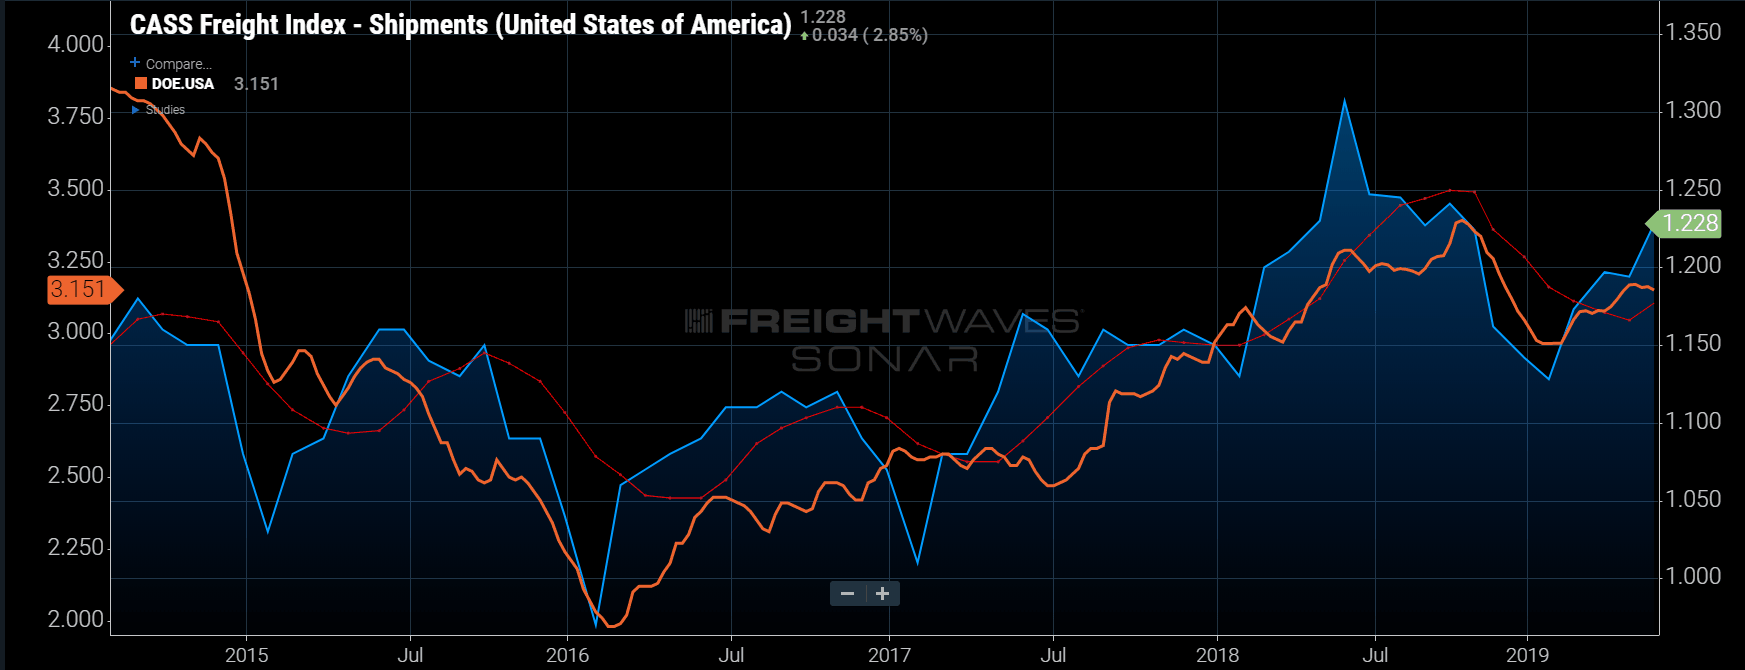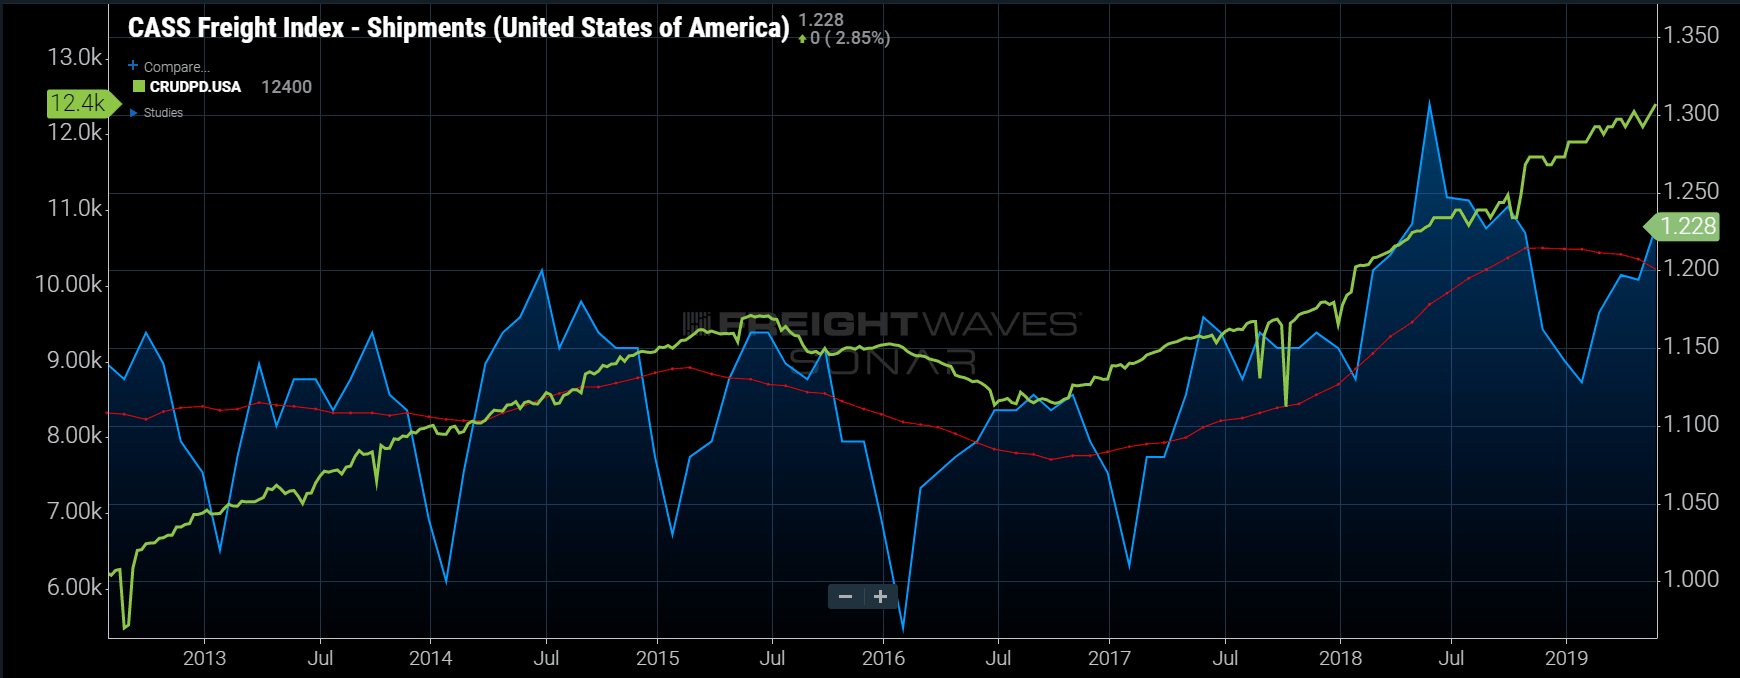
Chart of the Week: Cass Freight Index — Shipments, DOE Average Weekly Price of Diesel — USA (SONAR: CFIS.USA, DOE.USA)
At first it seems obvious, or it should after you hear it. Diesel prices increase as general freight volumes increase. After all, the largest consumers of diesel fuel in the U.S. are transportation providers such as trucking and rail companies, whose primary purpose is to move freight. As they consume more fuel, demand increases, which puts upward pressure on the price. This is certainly a bit of an oversimplification as there are other factors involved such as taxes and production cost, but the general direction is clear, as freight demand increases so does the price of diesel.
Looking at the Cass Freight Index, which measures total freight shipments in the U.S., there is a decline in freight volumes outside of the seasonal pattern from 2015 to 2016. Demand waned as volumes resulting from the production of durable goods declined, a similar pattern is starting to emerge this year, although not as severe.
The Cass Shipments Index experienced its lowest 12-month values in the past 9 years from October 2015 till September 2016. Similarly, the average weekly price of diesel reported by the department of energy dropped from $3.61 at the end of 2014 to $1.98 by early 2016 when the Cass index fell to 0.98, its lowest value since 2010.
The main driver for the rapid decline in price of diesel was not lower demand for freight transportation, however. The price of crude oil—20% of which is turned into diesel and heating oil—fell from over $100 in 2014 to under $30 in February of 2016.
There are multiple reasons for the decline in crude price, but the main drivers were a strengthening dollar and a global oversupply of oil. The cost of pulling oil from the ground exceeded the price it was fetching on the open market. Oil companies had to shut down their rigs and quit drilling, as the juice (oil) was no longer worth the squeeze (drill).
Production drives volumes
With oil production becoming a larger portion of the domestic industrial economy, this meant there was less production and more significantly for transportation providers, less freight to move.
Petroleum products are refined from crude oil and include fuels like gasoline, diesel, heating oil, and propane. Petroleum products also include consumer goods like plastics, polyurethane, and solvents. These products are moved around the country between plants and warehouses on surface transportation.

Doubly, the production facilities require more materials when they are producing more goods as well, which also increases freight volumes. In other words, production downstream increases production upstream.
As consumers, it helps when the price of gasoline is lower, but now that the U.S. is the largest producer of oil in the world (18% of the world total according to the EIA in 2018) as well as the largest consumer, the economy is very dependent on the health of the oil industry. When the price of oil drops too low, it hurts the economy.
There is a push and pull effect on the price of diesel and freight volumes. On one hand more freight means increased demand for diesel. On the other hand, more oil production leads to a healthier industrial economy and more durable goods moving through the system. It is a feedback loop that requires a delicate balance to operate smoothly.
The average price of diesel increased slowly from January to May this year before falling through June and July. The price of crude oil has followed a similar path flattening a bit in July. Transportation providers have an obvious interest in these numbers as it pertains to cost, but also as a measure of the health of their revenue streams.
About the Chart of the Week
The FreightWaves Chart of the Week is a chart selection from SONAR that provides an interesting data point to describe the state of the freight markets. A chart is chosen from thousands of potential charts on SONARto help participants visualize the freight market in real-time. Each week a Market Expert will post a chart, along with commentary live on the front-page. After that, the Chart of the Week will be archived on FreightWaves.com for future reference.
SONAR aggregates data from hundreds of sources, presenting the data in charts and maps and providing commentary on what freight market experts want to know about the industry in real time.
The FreightWaves data science and product teams are releasing new data sets each week and enhancing the client experience.
To request a SONAR demo click here.


Charles Wilmoth
Zach just isn’t gonna mention the COST,COST +,OR COST- THE LARGE FLEETS ARE ACTUALLY PAYING IS HE,he does mention the false price NOT being paid which is the DOE price.ZACH needs to be removed from reporting on any DIESEL COST until he understands TRUTH in reporting.Example of real cost is DOE $3.02/gal, actual cost for large fleets,$1.27!