This week’s FreightWaves Supply Chain Pricing Power Index: 40 (Shippers)
Last week’s FreightWaves Supply Chain Pricing Power Index: 40 (Shippers)
Three-month FreightWaves Supply Chain Pricing Power Index Outlook: 40 (Shippers)
The FreightWaves Supply Chain Pricing Power Index uses the analytics and data in FreightWaves SONAR to analyze the market and estimate the negotiating power for rates between shippers and carriers.
This week’s Pricing Power Index is based on the following indicators:
Volumes recovering from holiday drop
The holidays disrupted the flow of freight volumes, especially with both Christmas and New Year’s Day falling on a Wednesday. The result of that is a sizable drop in volumes that has become expected with the seven major holidays: New Year’s, Memorial Day, Fourth of July, Labor Day, Thanksgiving and Christmas, and to a lesser extent, Martin Luther King Jr. Day.

To learn more about SONAR, click here.
The Outbound Tender Volume Index (OTVI), a measure of national freight demand that tracks shippers’ requests for trucking capacity, is recovering from the dramatic drop associated with the holidays, rising 19.3% over the past week. It will take at least another week to offset the holiday to paint the true picture of the volume side of the market. Similar to how the market closed out 2024, the beginning of 2025 still lags behind year-ago levels, currently down 6.98% year over year.
The potential for another strike by the International Longshoremen’s Association in less than two weeks, along with the Lunar New Year looming less than a month away, could provide a short-term shot in the arm for volumes. With that said, based on the Inbound Ocean TEU Volume Index, which represents ocean volumes as they depart overseas, it appears less likely as there hasn’t been a significant pull forward like there was this time last year.

To learn more about SONAR, click here.
Contract Load Accepted Volume (CLAV) is an index that measures accepted load volumes moving under contracted agreements. In short, it is similar to OTVI but without the rejected tenders. Looking at accepted tender volumes, the increase is greater than the increase in OTVI, due to a decline in tender rejection rates, rising 22.66% week over week. CLAV is still down 9.5% y/y.
Both Mastercard and Visa spending data suggested a strong retail holiday season, with spending up 3.8% and 4.8% y/y, respectively. In a recent Reuters article, retail executives labeled consumers as “cautious” and “conservative,” and if those trends continue into 2025, it could create some pressure from a volume perspective that outpaced GDP growth for much of 2024. Even so, if the industrial side of the economy wakes from its slumber, it could more than offset any potential weakness from the consumer.
To learn more about SONAR, click here.
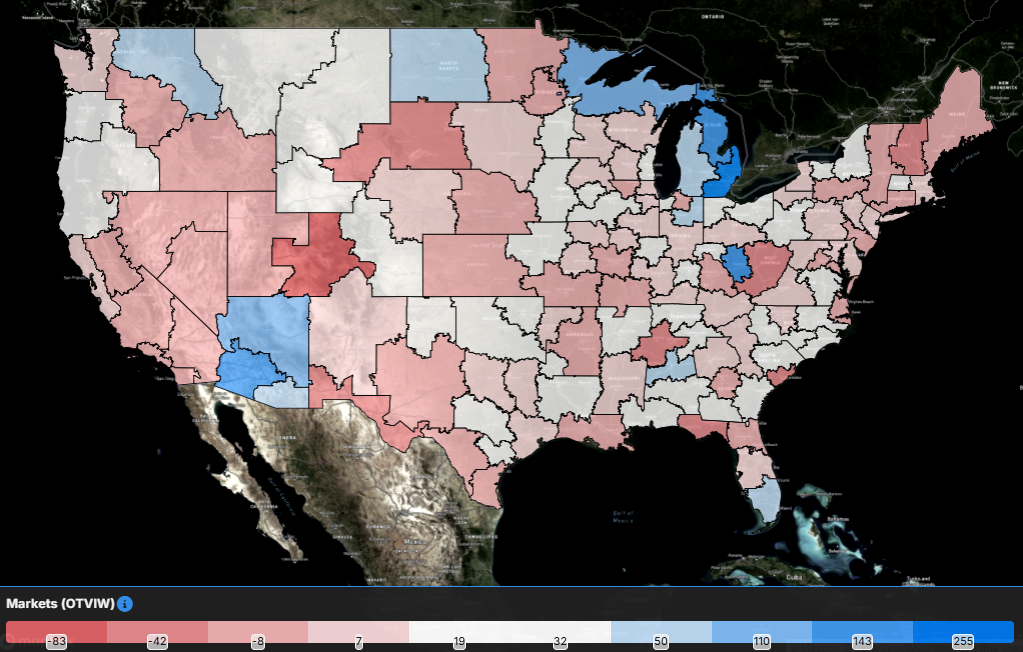
As the market recovers from the holiday season, the vast majority of the freight markets have seen growth in tender volumes over the past week. Of the 135 markets tracked within SONAR, 113 reported higher volumes over the past week. This isn’t a surprise given the impacts of the holidays are still in full swing. The comparisons in coming weeks will be far more representative of true volume changes than those holiday-affected weeks.
The Ontario, California, market, which has been at the top of the volume charts for much of 2024, did see a smaller increase than at the national level as volumes increased by 5.11% w/w. It’ll be interesting to see whether, now that the holidays have passed and freight becomes less time-sensitive, intermodal volumes out of the market move higher and truckload volumes come under pressure during the first quarter.

To learn more about SONAR, click here.
By mode: The dry van market had a fairly impressive recovery in the past week, but volumes remain down by double digits compared to last year. The Van Outbound Tender Volume Index rose by 19.8% over the past week but is still down 10.2% year over year.
The recovery in the reefer market is less impressive than that of the dry van market, but volumes are still up year over year. The Reefer Outbound Tender Volume Index increased by 8% over the past week. Compared to this time last year, reefer volumes are up 6.5%, showing that the reefer market continues to enjoy relative strength.
Tender rejection rates retreat from holiday highs
Tender rejection rates are retreating from their recent highs, but the reaction around the holiday provides a positive sign for carriers entering 2025. The first two months of the year will likely still be challenging for those in the market, which will lead to continued exits in capacity, but it sets up the middle of the year to be far better than it has been in the past two years.

To learn more about SONAR, click here.
Over the past week, the Outbound Tender Reject Index (OTRI) fell by 256 basis points, an indication of capacity returning to the road, to 7.13%. Tender rejection rates are still 236 basis points higher than they were this time last year, a sign that the market is definitely tighter than it was this time last year, even if it doesn’t feel that way to everyone in the market.
To learn more about SONAR, click here.
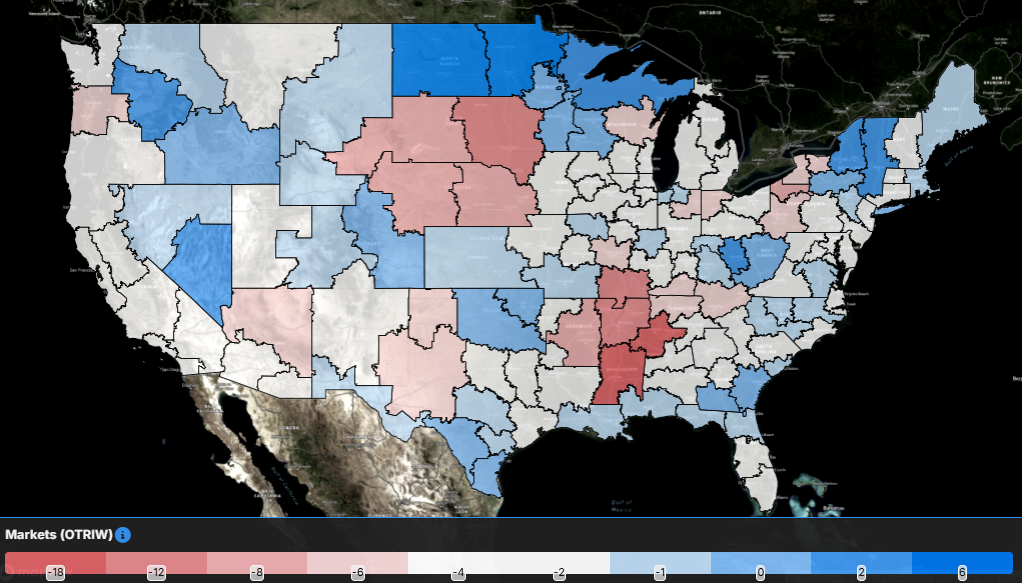
The map above shows the Outbound Tender Reject Index — Weekly Change for the 135 markets across the country. Markets shaded in blue are those where tender rejection rates have increased over the past week, whereas those in red and white have seen rejection rates decline. The bolder the color, the more significant the change.
Of the 135 markets, 22 reported higher rejection rates over the past week, down from the 67 that saw tender rejection rates rise in last week’s report.
It’s no surprise that capacity is returning to the highest-volume markets: Atlanta, Dallas and Ontario, California. Tender rejection rates in these markets are all down 200 basis points over the past week. Both Ontario and Atlanta are back below the national average. The positive sign is that rejection rates in each of these markets are still over 200 basis points higher than they were this time last year. Savannah, Georgia, was the only market in the top 35 largest freight markets by volume where tender rejection rates increased by over 100 basis points, rising 179 bps week over week.

To learn more about SONAR, click here.
By mode: Tender rejection rates across all three modes are lower this week, but the dry van market experienced the smallest decline of the three. The Van Outbound Tender Reject Index fell by 225 basis points over the past week to 6.46%. Compared to this time last year, dry van tender rejection rates are up 89 basis points.
The reefer market remains the tightest equipment type tracked within SONAR, despite the decrease in rejection rates over the past week. The Reefer Outbound Tender Reject Index fell by 275 bps over the past week to 15.84%. Reefer tender rejections are still more than double what they were this time last year, currently up 811 bps y/y.
The flatbed market experienced the largest decline in tender rejections over the past week, but the market will likely remain under some pressure until warmer weather hopefully brings more projects. The Flatbed Outbound Tender Reject Index fell by 648 bps over the past week to 10.88%. Flatbed tender rejection rates are holding onto y/y gains, currently up 89 bps.
Spot rates still rising as capacity returns to the road
Though tender rejection rates are retreating from their recent highs, it hasn’t stopped spot rates from continuing to rise over the past week. The positive momentum in spot rates that really started in early October hasn’t been as quick to fade as the momentum in rejection rates. Spot rates are likely to face pressure over the next couple of months, but the increases to close out 2024 should help create a higher floor for spot rates.
To learn more about SONAR, click here.
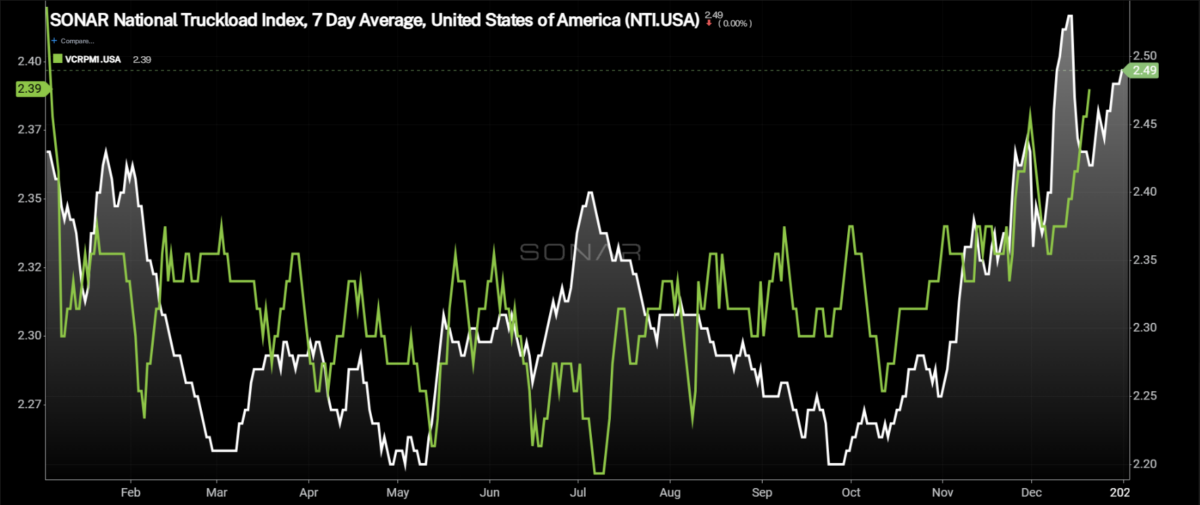
The National Truckload Index – which includes fuel surcharge and various accessorials – continued to increase, rising 3 cents per mile to $2.49. The NTI is 6 cents per mile higher than it was this time last year as the gap has narrowed as capacity has been fairly quick to return to the roads. The linehaul variant of the NTI (NTIL) – which excludes fuel surcharges and other accessorials – matched the increase in the overall NTI, rising 23 cents per mile to $1.94. The NTIL is 10 cents per mile higher, the narrowest the gap has been since early October.
Initially reported dry van contract rates, which exclude fuel, fell off their recent Thanksgiving high, returning to the range they have been in for much of the year. The initially reported dry van contract rate, excluding fuel, increased by 4 cents per mile over the past week to $2.38. The initially reported dry van contract rate is reported on a two-week lag, so the impacts of the holiday are just starting to put upward pressure on contract rates. Compared to the same period last year, dry van contract rates are up 7 cents per mile.

To learn more about SONAR, click here.
The chart above shows the spread between the NTIL and dry van contract rates is trending back to pre-pandemic levels. The spread remains wide, but with the recent moves in both spot and contract rates, it moved even wider than it was a week ago. Over the past week, the spread widened by 12 cents to minus 49 cents. Compared to this time last year, the spread is 20 cents per mile narrower than it was, another sign that the market is moving to a more carrier-friendly environment.
To learn more about SONAR, click here.
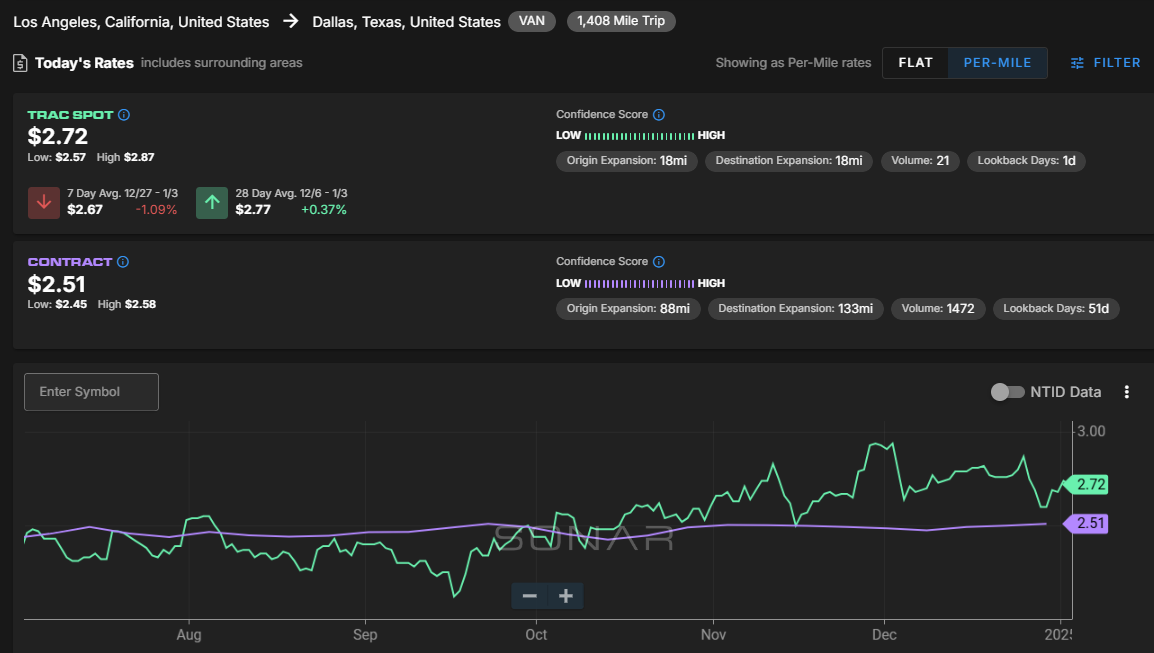
The SONAR Trusted Rate Assessment Consortium spot rate from Los Angeles to Dallas fell slightly over the past week but remained above contract rates. The TRAC rate from Los Angeles to Dallas decreased by 3 cents per mile to $2.72. Spot rates along this lane are 21 cents per mile above the contract at present, which could be a reason why capacity was quick to return to the Southern California market.
To learn more about SONAR, click here.
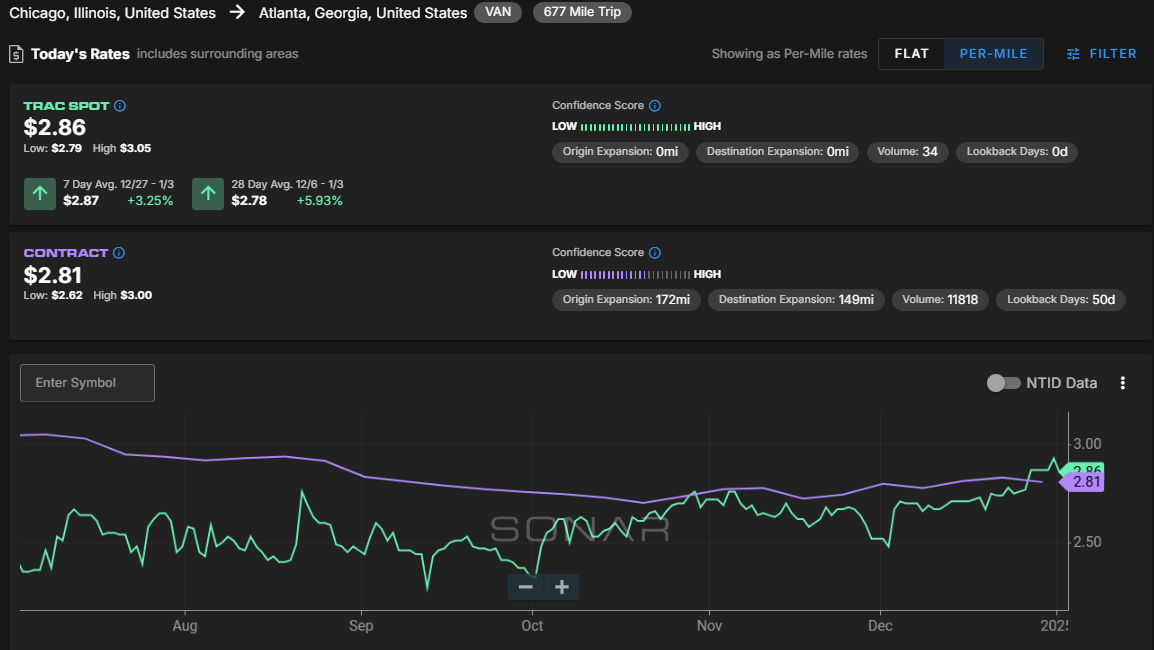
From Chicago to Atlanta, spot rates have been volatile, finally moving above contract rates and to the highest level in the past six months. The TRAC rate for this lane increased over the past week by 9 cents per mile to $2.86. Spot rates are now 5 cents per mile higher than contract rates, which could lead to tighter conditions along this lane.


