There’s an old saying: “You can’t stop a big ship on a dime.” A fully loaded supertanker can take 20 minutes over a 15-mile stretch to go from full speed to full stop. The higher the mass of an object in motion, the greater its inertia.
The same goes for global trade, which is much bigger than a supertanker. According to new data from Boston-based CargoMetrics, ocean shipping is definitely not stopping on a dime, despite the coronavirus’ massive impact on global demand.
In February, CargoMetrics released data showing that Chinese imports and exports were “in freefall” compared to levels in 2012-19 as a result of the lockdown of Wuhan province. A follow-up dataset in early March revealed Chinese volumes rapidly rebounding to normal levels.
But that was before the U.S. and countries in Europe began strict social distancing and quarantines.
To discern how the new economic pressures have affected vessel demand, FreightWaves asked CargoMetrics for updated data on Chinese and U.S. imports and exports, as well as a global perspective.
Global perspective
“If I was to pick out a theme globally, I’d say it’s that supply chains are functioning,” said Dan Brutlag, CargoMetrics’ head of trading signal and data products, in an interview with FreightWaves on Tuesday.
“If you looked at our data without any context about what is happening in the world, you wouldn’t necessarily conclude that we were in the middle of a global economic crisis,” he said. The caveat, he acknowledged, is that “there may be a delayed onset because shipments are already en route and there could be stockpiling until storage is filled up.”
CargoMetrics estimates import and export cargo flows in terms of the mass transferred on and off ships; its findings are based on ship-positioning data and quantitative predictive algorithms. Brutlag reported that global imports over recent months are about 5% lower than exports, which he said could be the result of “floating storage and vessels being delayed en route.”
Chinese imports
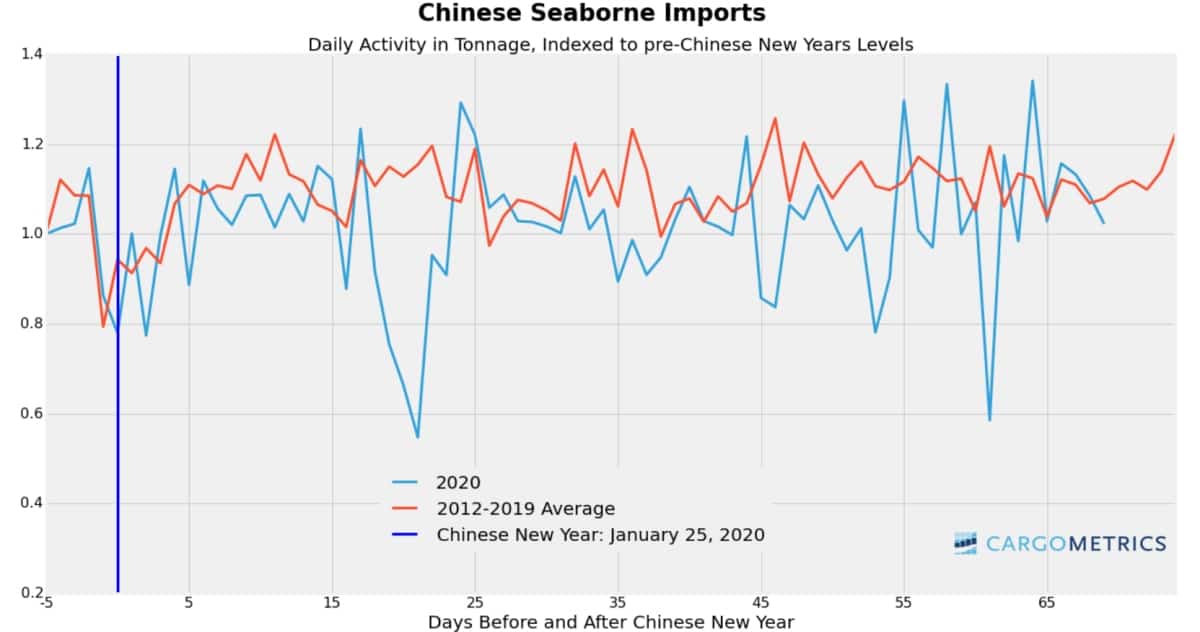
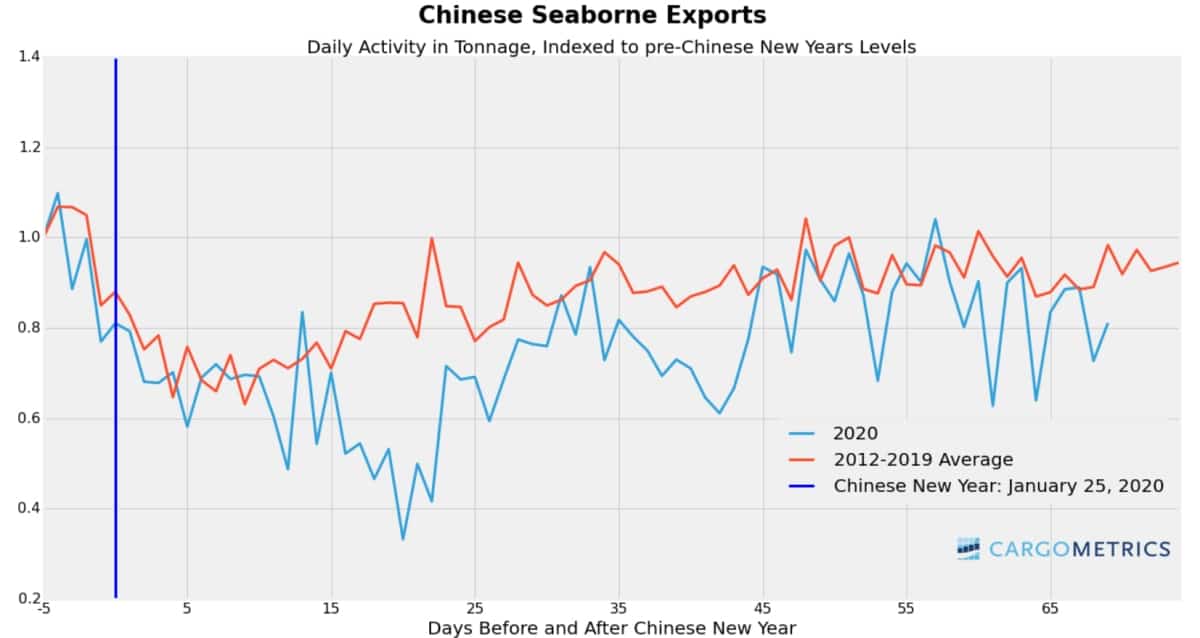
To account for the major effect of Chinese New Year (CNY) on cargo movements, CargoMetrics analyzed Chinese trade flows as an index (1.0 = five days prior to CNY) and compared this year to the average in 2012-2019. Its latest dataset runs through April 3.
Chinese imports suffered a sharp drop after CNY during the coronavirus lockdown. Brutlag said the post-CNY declines were primarily due to lower volumes for dry bulk and container ships. Since then, overall import volumes have bounced back “with containers overshooting to higher-than-usual levels [after the CNY decline] and then reverting back to the norm,” he said, adding that Chinese tanker import volumes have remained close to historical norms over the period covered by the index.

Chinese exports
On the Chinese export side — which is of considerable interest to U.S. transport businesses — CargoMetrics data shows a sizeable drop in February, when container exports were waylaid by the Wuhan lockdown and carriers “blanked” (cancelled) sailings. By March, however, volume had rebounded. “At this point, Chinese exports are within normal range,” said Brutlag.
Carriers have announced a large number of blanked sailings in April and May in response to booking cancellations by European and U.S. buyers and as a strategy to support freight rates. “You should start seeing it showing up in the Chinese export data pretty soon,” he noted.

U.S. exports
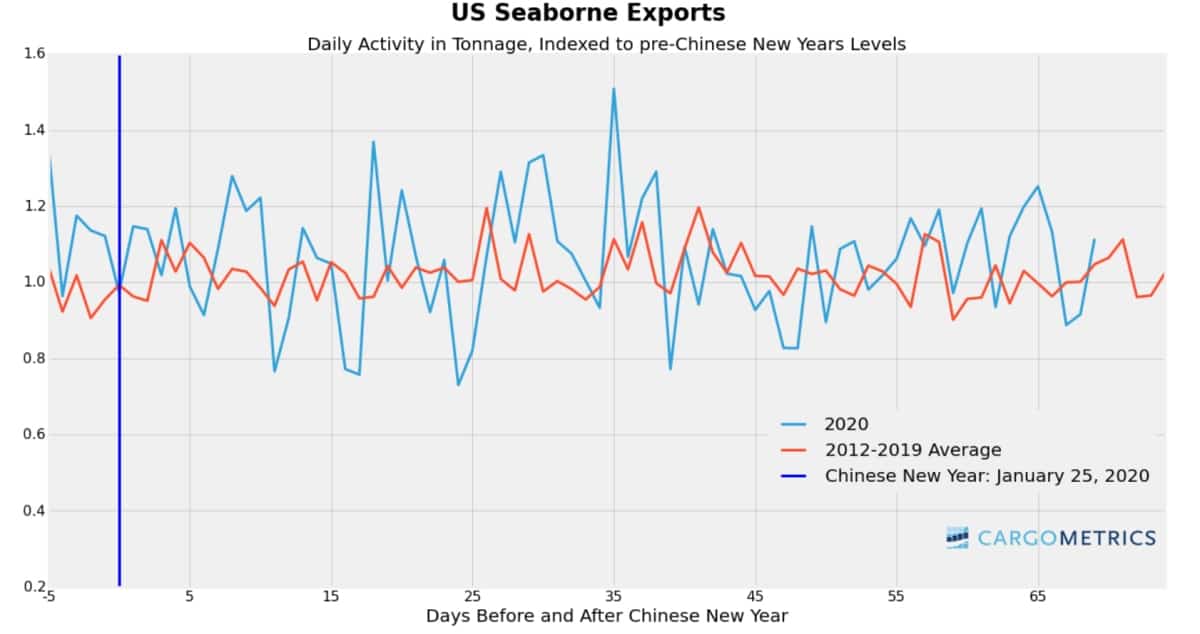
The CargoMetrics data on U.S. exports (indexed in the same fashion as the Chinese data) underscores the inertia of global trade. The 2020 index numbers closely follow the 2012-2019 average.
“It’s all within the normal range on the export side, and even when you divide up the aggregate U.S. export chart by sector [container, dry cargo, tankers] everything still looks to be within normal range,” said Brutlag.

US imports
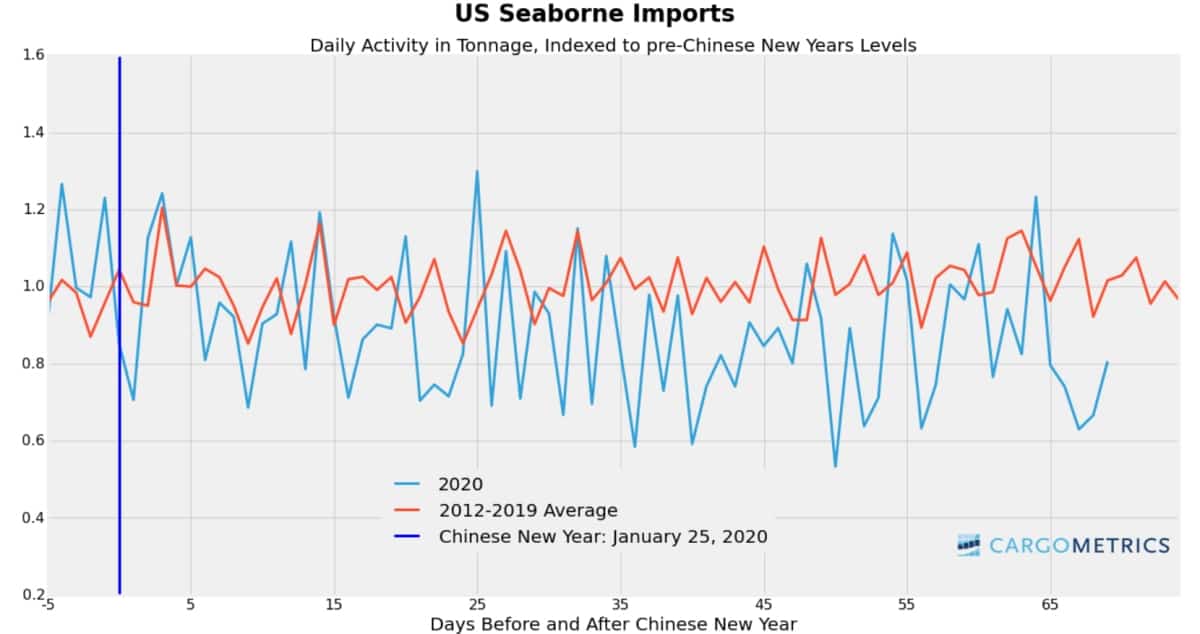
The fate of U.S. seaborne imports is of the greatest interest to U.S. port operators and domestic trucking and rail companies. “Total imports in terms of tonnage are about 20% below their usual levels, driven by a decline in containers,” Brutlag said.
Container imports to the U.S. show a lag effect in relation to container exports from China. It takes around 20-24 days for a box ship to transit from China to Los Angeles/Long Beach, and around 35 days to New York/New Jersey. The cancelled sailings from China in the wake of the post-CNY Wuhan lockdown in February and March show up later in the U.S. numbers.
“I do think to some extent it [dropping U.S. imports] is a delayed onset of the drop-off we saw in Chinese exports a couple of months ago,” said Brutlag.
The surge in blank sailings announced by container lines for this month and next month will not show up in the U.S. import data until May and June. Like a big ship ordered to a sudden stop, it takes time to reverse the momentum. Click for more FreightWaves/American Shipper articles by Greg Miller


Matthew Brandley
Over 300 ships have cancelled port calls in the next 90 days in the United States fue to low or no cargo. Again another bs article