


June data from Cass Information Systems showed continued weakness in volumes and expenditures, with year-over-year declines largely mirroring the trends displayed in May.
Shipments captured by the Cass Freight Index fell 6% y/y in June and were off 1.8% from May, “amid ongoing softness in for-hire [truck] demand,” a Monday report compiling freight stats from several transportation modes said.
The shipments subindex fell to its lowest point since January despite June typically being a big month for freight flows. When seasonally adjusted, the index reached its lowest level since July 2020 when widespread COVID-related lockdowns were starting to be lifted.
The 6% drop was the highest rate of decline in five months. Compared to two years ago, the subindex was down 10.4%, which was a second straight double-digit decline after logging low- to mid-single-digit declines earlier in the year.
The previous forecast called for the dataset to dip just 4% y/y in June.
The report pointed to an increase in the number of private companies using internal assets to move their freight during this period of “slowing economic growth” and “broadly flattish” goods demand, as reason for the weakness.
“We see the insourcing of freight via private fleet capacity additions as the main driver of the y/y decline in for-hire volumes,” the report said.
The outlook for the shipments’ subindex calls for volumes to be off 4% y/y in July and down 5% y/y for full-year 2024.
“If there’s any silver lining, this is starting to look like a real bottom,” the report said, as the y/y comps get easier moving forward.
| June 2024 | y/y | 2-year | m/m | m/m (SA) |
| Shipments | -6.0% | -10.4% | -1.8% | -1.8% |
| Expenditures | -9.4% | -31.6% | -3.0% | -3.2% |
| TL Linehaul Index | -2.4% | -16.2% | -1.0% | NM |
Freight expenditures were down 9.4% y/y in June, in line with the decline recorded a month ago, but 3.2% below May on a seasonally adjusted basis. On a two-year comparison, expenditures fell more than 30%, which was the largest decline recorded by the 34-year-old dataset. However, the expenditures data can be volatile as it is impacted by modal mix shift as well as fluctuations in fuel and accessorial charges.
The expenditures subindex was down 16% y/y in the first half of the year and is expected to decline 11% to 12% on a full-year comparison, which is unchanged from the month-ago forecast.
The y/y decline in the expenditures subindex was 340 basis points more pronounced than that of the shipments subindex. The implication is that actual core freight rates were likely off by similar percentage. Inferred rates were 3.6% lower y/y in June and 1.4% below May when seasonally adjusted.
Inferred rates for full-year 2024 are now expected to be down 7% y/y, 100 bps lower than the update provided last month.
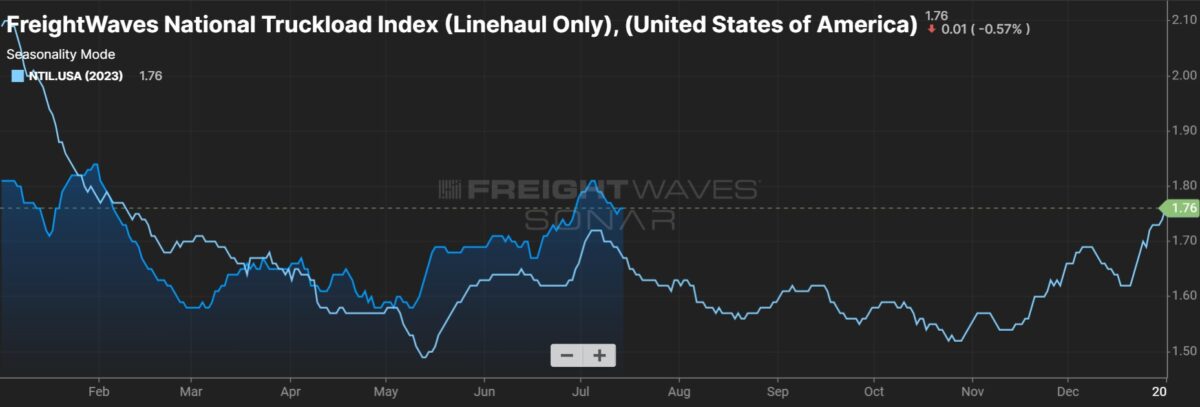
The Truckload Linehaul Index, which displays core rates excluding fuel and accessorial charges, fell 1% from May and was down 2.4% y/y. The linehaul index includes spot and contract freight.
“The freight market continues to be characterized by overcapacity, and with private fleets engaging in spot activity more than in past cycles, rates remain only slightly above the Q4’23 lows,” the report said. “Owner-operators are resilient as ever, but ongoing private fleet capacity additions are putting less freight into the for-hire market in a slowing economy.”
Data used in the indexes is derived from freight bills paid by Cass (NASDAQ: CASS), a provider of payment management solutions. Cass processes $38 billion in freight payables annually on behalf of customers.