FREIGHTWAVES’ SONAR CHART OF THE WEEK (September 2-Sept 8, 2018)
Chart of the Week: Outbound Tender Volume Index for the U.S. (OTVI.USA)
SONAR (OTVI.USA) OTVI measures freight volume in the entire market, indexed against March 1, 2018. For the first half of August, OTVI was higher than the March 1 number (anything above 10,000). For the second half of August, OTVI was less than the March 1 number. To make things easier, we are showing the chart in a baseline view and red means it is below the 10k mark, green means it is above the 10k mark.Freight volume in the third quarter of 2018 has been stronger so far than the second quarter of 2018, it just doesn’t feel that way.
Trucking freight volumes in July and August were ususually strong this year and much stronger than the start of the second quarter. We know this because we track electronic freight tenders in the entire market and index those to a specific date, March 1, 2018. This gives us a view of total volume in the market, relative to this reference date. This data is turned into an index we call: Outbound Tender Volume Index or OTVI for short. This data is then presented inside of SONAR, our market dashboard, by market.
If you look back at April and the first half of May, the OTVI chart showed that the volume of freight in the market was less than the July and August levels. Carriers that felt Q2 was stronger and the market was slowing in Q3, would be basing this on how strong Q2 finished up, not how strong it started (it didn’t). We didn’t see an increase in freight demand in the 2nd quarter until May 9th. Even the softest point in August, on the 21st, the OTVI index was still above most of April’s number.
One thing to keep in mind, is that OTVI just measures total freight volume in the market, it does not determine whether there is also more capacity in the market. We know from our data that capacity has been growing over the past year. You can see it in the employment data and truck order data, but because of the fragmentation of the market it is harder to get a precise estimate of capacity growth.
At the end of the day, if total market volume does not bring additional freight opportunties to an individual carrier, that fleet could care less about what is happening in the whole market. Turn-downs, or tender rejections, are the best predictor of carrier freight choices. The higher the rejection index is, the better conditions for carriers.

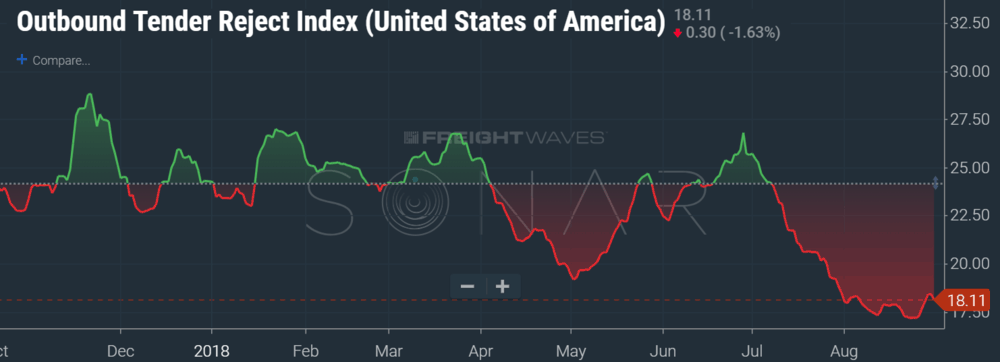
We did see some softness in the tender rejections in August. In fact, tender rejections in the month of August were the lowest point we have seen since we started tracking them in October of last year.
On April 1st, tender rejections were at 24.85%. By the end of the month, they were hovering at 19.85%. In August, tender rejections started at 18.15%, dropped to a low of 17.16% and softly trended up to 18.45%. Basically, any participant that was wanting higher volatility (brokers or carriers that operate in the spot-market), you were out of S.O.L.
For shippers that do not want market volatility things are looking up. It is apparent that the super-hot inflated spot market has calmed down for now. Rates are trading in a tight range and we are not seeing surges. This indicates that carriers are honoring their commitments, but not seeing conditions such that allow them to get higher rates or decline committed lanes.

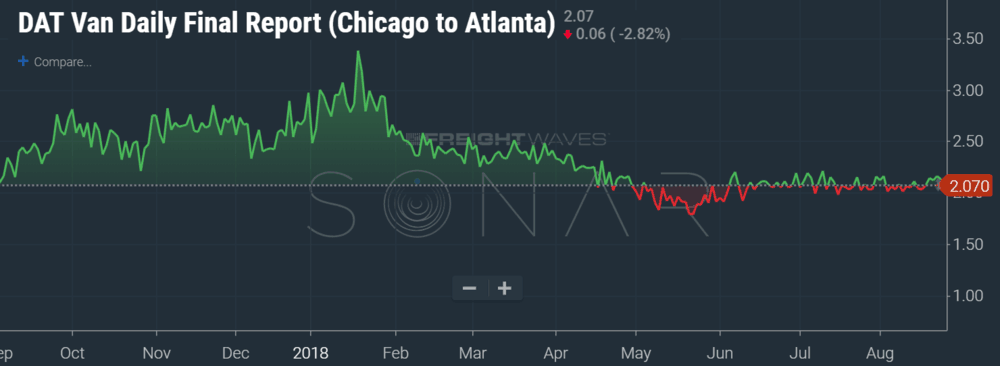
One benchmark lane, the Chicago to Atlanta lane, has been range bound from $2.16 per mile to $2.00 the entire month of August, according to the DAT Daily Freight Index provided by DAT. Looking back at the past 12 months, this is the most stable we have seen this lane the entire period.
Why is this happening?
We believe that capacity has come back into the market, particularly capacity focused on the spot-market. No one should panic- the additional capacity in the spot market is providing stable conditions for participants, but not increasing at a pace that would drag rates down. As long as the economy holds, the growth of spot market capacity will unlikely outpace freight volume growth. For companies that thrive on higher spot-rates, i.e. freight brokers, expeditors, and spot-only trucking companies, softer volatility means lower margin opportunities. But for everyone else, rates and volumes are still up, meaning higher revenues per mile and higher utilization for carriers.

In fact, on the Chicago to Atlanta lane, DAT’s Daily Freight Index in August 2018 is 21% higher than the average on the same lane in August 2017.
We also believe that shippers have been thinking about their supply-chains completely different than before. After suffering from chaotic conditions in the first half, shippers have agreed to pay carriers higher rates on contract lanes, are planning further ahead of time on their load tenders, and are originating shipments from markets where capacity is denser. Also, intermodal has become a major part of any shipper’s capacity planning, as both a hedge against capacity shortages and run-away spot-rates.
About Indices presented in this article
(OTVI.USA) Outbound Tender Volume Index measures the total amount of freight tenders in the market, on a seven-day moving average, versus volume on March 1, 2018. This index is intended to track how high demand is for trucking freight, measured by volume of loads. While the data is broken down in 135 total markets, for the purposes here, we are using the entire USA.
(OTRI.USA) Outbound tender rejection index measures the total amount of electronic loads rejected in the freight market. OTRI is a great indicator to understand the ability for carriers to enjoy optionality in their freight selection. Higher optionality means that carriers will enjoy higher quality loads at higher rates. Lower optionality means that carriers will have to take lower quality freight at lower prices.
(DATVF.CHIATL) DAT Van Final Spot Rate, Chicago to Atlanta lane. This index shows DAT’s spot-price assessments on a specific lane, Chicago to Atlanta. The purpose of this index is to provide participants with benchmarks of trucking spot rates for a few select lanes, assessed by DAT. SONAR only shows seven lanes total, out of 18,000+. The purpose of the index in SONAR is to provide benchmark references be used to settle trucking freight futures contracts (to be launched in the next few months).
About Chart of the Week
The FreightWaves Chart of the Week is a chart selection from SONAR that provides an interesting data point to describe the state of the freight markets. A chart is chosen from thousands of potential charts on SONAR to help participants visualize the freight market in real-time. Each week the Sultan of SONAR will post a chart, along with commentary live on the front-page. After that, the Chart of the Week will be archived on FreightWaves.com for future reference.
SONAR aggregates data from hundreds of sources, presenting the data in charts and maps and providing commentary on what freight market experts want to know about the industry- in real time.
The FreightWaves data-science and product teams are releasing new data-sets each week and enhancing the client experience.
To find out more about SONAR go here or to setup a demo click here.


Mark Montague
Zach, I could not agree more. Yes, third quarter volumes are up. In fact spot market van had the highest weekly average number of loads for the year in August. Contract carriers and intermodal providers are seeing strong rate increases. Unlike last winter, though, some areas have softened as far as demand. Texas, in particular sees a slowdown resulting for reduced drilling in the Permian Basin. But with pipeline projects stretching into the next five years, this may only be a blip. Btw fall produce is really starting to hum.