Headhaul Index presented on SONAR maps (SONAR:HAUL). The darker the blue, the higher the headhaul conditions for the market. The whiter the market, the more of a backhaul condition for the market.
FREIGHTWAVES’ SONAR CHART OF THE WEEK (Sept 9-Sept 15, 2018)
Chart of the Week: Headhaul Index (SONAR: HAUL)
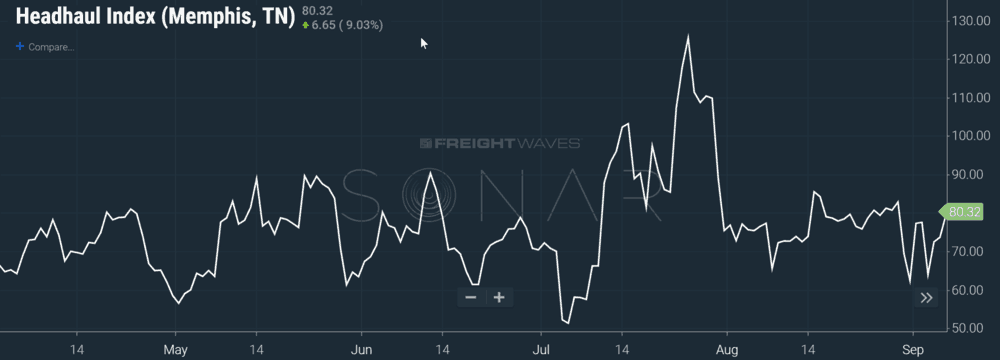
Memphis currently ranks as the top headhaul market in the U.S. The top five headhaul markets in the U.S. are:
1. Memphis: 80.32
2. Ontario, CA: 79.07
3. Harrisburg, PA: 76.02
4. Bloomington, IL: 62.50
5. Los Angeles, CA: 61.32
Truckers tend to get caught up in rate discussions a lot around the industry and rightfully so. Rates drive profitablity. What else drives profitability: Utilization (i.e. maximizing miles per day).
How does a trucker maximize utilization? Picking markets that are “headhaul” markets and avoiding “backhaul” markets.
What is a headhaul market? A headhaul market is one where there are more outbound loads than inbound loads (the reverse would be a backhaul market). If you want to maximize your load selections (i.e. the ability to pick the best loads), then pick markets that are currently in headhaul mode. The higher the ratio of outbound to inbound loads, the greater the chance of finding a load to a desirable market, avoiding a layover, and keeping the wheels turning.
Because the freight market is so volatile, it can be difficult to determine which markets are headhauls vs. backhauls on any given day. To make this easier, we created the “Headhaul Index”, exclusively on SONAR.

The chart above references the Memphis headhaul conditions. You can see that it has stayed in headhaul conditions for the whote year. What is not presented in the chart above (but can be found inside the analytics tools of SONAR) is that Memphis has consistently been the strongest market this year. In July the market even peaked at 125.50 on July 25th.
Folks that have been around the freight market for years are unlikely to be surprised by Memphis’ standing as a huge headhaul market. Nestled off of I-40 and I-55, the city has been a major distribution center for over a century. Memphis is the largest city on the Mississippi River, making it a natural inland port for bulk cargoes. More importantly, Memphis is a major force in the e-commerce world with FedEx’s HQ and hub being located in the city. The Memphis airport is #2 in air-cargo volumes, globally.

In addition to FedEx’s enormous presence in the city, major shippers such as Target, Nike, Williams-Sonoma, Technicolor, Ford, and McKesson have multi-million sq. ft. distribution centers in the city. Nike’s largest distribution center in the world was opened in Memphis in 2015.
About Indices presented in this article
(SONAR: HAUL) Headhaul. The headhaul index identifies the spread between outbound loads and inbound loads in a specific market. The higher the number, the more likely a trucker will find a load out of a specific market. The lower the number, the more likely the trucker will end up laying over in that market. For carriers choosing between different load choices to accept, the market with the higher numbers offer the highest chances for a carrier to maximize their miles out of that market. The number changes daily and will fluctuate as freight flows change over time.
About Chart of the Week
The FreightWaves Chart of the Week is a chart selection from SONAR that provides an interesting data point to describe the state of the freight markets. A chart is chosen from thousands of potential charts on SONAR to help participants visualize the freight market in real-time. Each week the Sultan of SONAR will post a chart, along with commentary live on the front-page. After that, the Chart of the Week will be archived on FreightWaves.com for future reference.
SONAR aggregates data from hundreds of sources, presenting the data in charts and maps and providing commentary on what freight market experts want to know about the industry- in real time.
The FreightWaves data-science and product teams are releasing new data-sets each week and enhancing the client experience.
To find out more about SONAR go here or to setup a demo click here.


