The views expressed here are solely those of the author and do not necessarily represent the views of FreightWaves or its affiliates.
We have witnessed global recessions before. But nothing quite like this 2020 version with a one-two biological and oil price war punch.
Let’s examine the second quarter outlook for railroad-hauled tank car commodities.
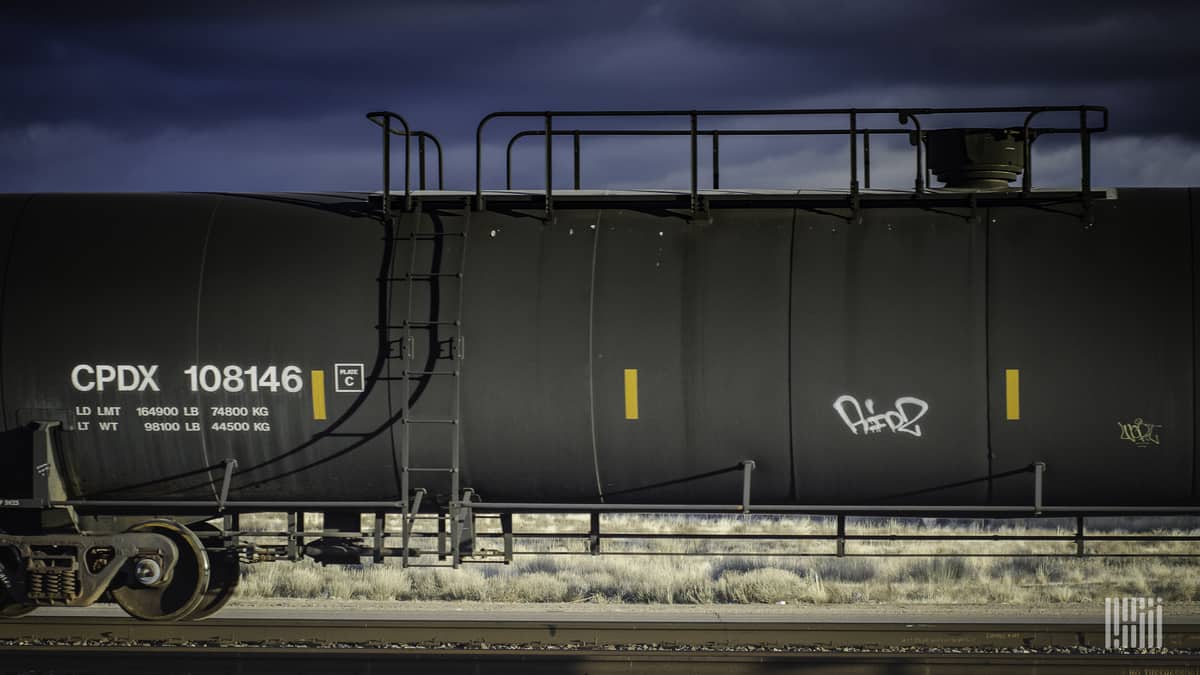
There are three broad railroad tank car markets – chemicals, crude oil and selected agricultural commodities. Across North America, the number of tank cars in the fleet increased from ~300,000 in 2009 to ~432,000 in 2019.
| Car Type | 2019 End Yr. Units | % Private |
| Tank Cars | 432k | 100% |
The chemical tank car market
The chemical market constitutes about 13% of all the carloads of rail traffic moved during 2019. If petrol and crude oil are added, the market size is just under 20% of all rail carloads.
Some of the chemical business moves in covered hopper cars rather than tank cars – but overwhelmingly the tank is the railcar used.

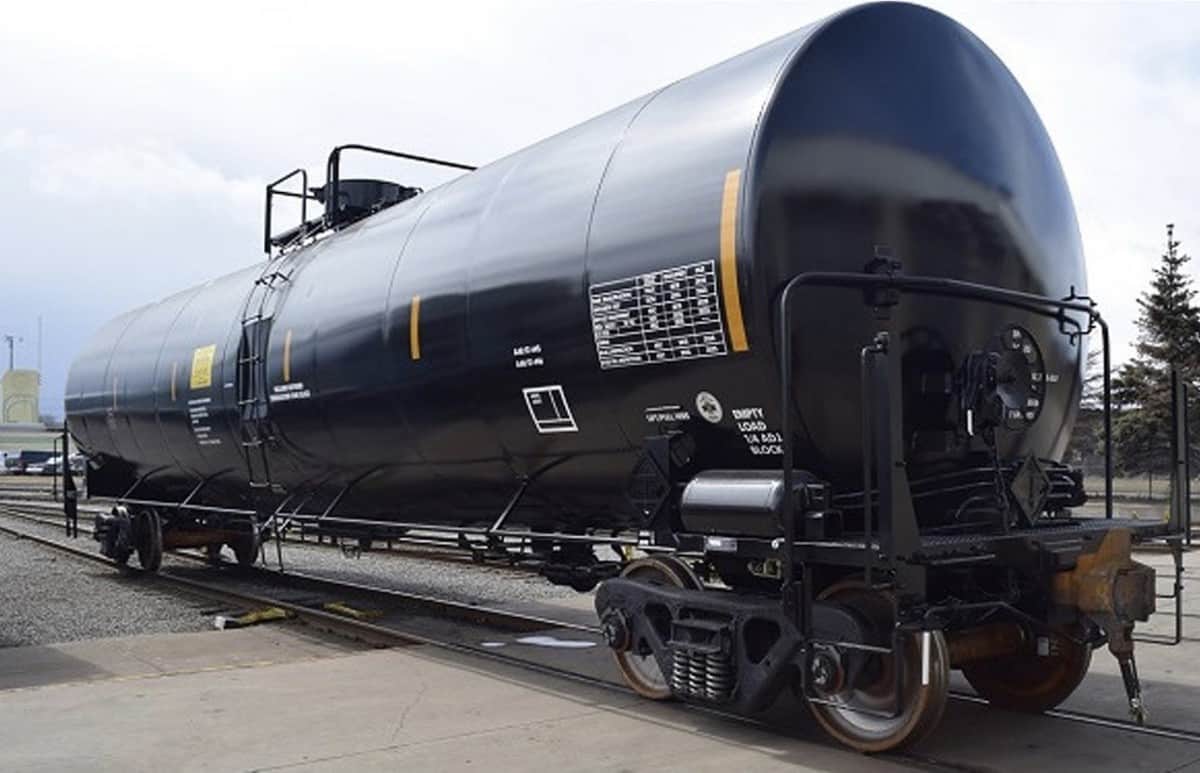
(Photo credit: National Steel Car)
Based upon the first two months of 2020 there was a clear upside. A 3% to 5% year-over-year increase for all of 2020 looked promising in early March. Yet, there was an uneasiness.
Now, the second quarter might see a 5% or greater chemical carload movement drop versus last year’s volume.
Crude oil carload market
Crude oil moving in tank cars had been growing this year with February a +7.2% carload increase in petroleum products moved. Crude oil was about 29% of this overall commodity category. Shipments of heavy crude oil into the United States from Canada was the largest crude oil market segment of this approximately 54,000 monthly carload total.
That monthly volume compares to 132,000 of chemical carloads moved.
Crude oil was considered a high growth market back in the period 2009 to about 2013.
At its peak in 2014, crude oil accounted for 1.6% of total originated Class I carloads. In 2019, crude oil’s share was 0.8% for all Class 1 originated carloads.
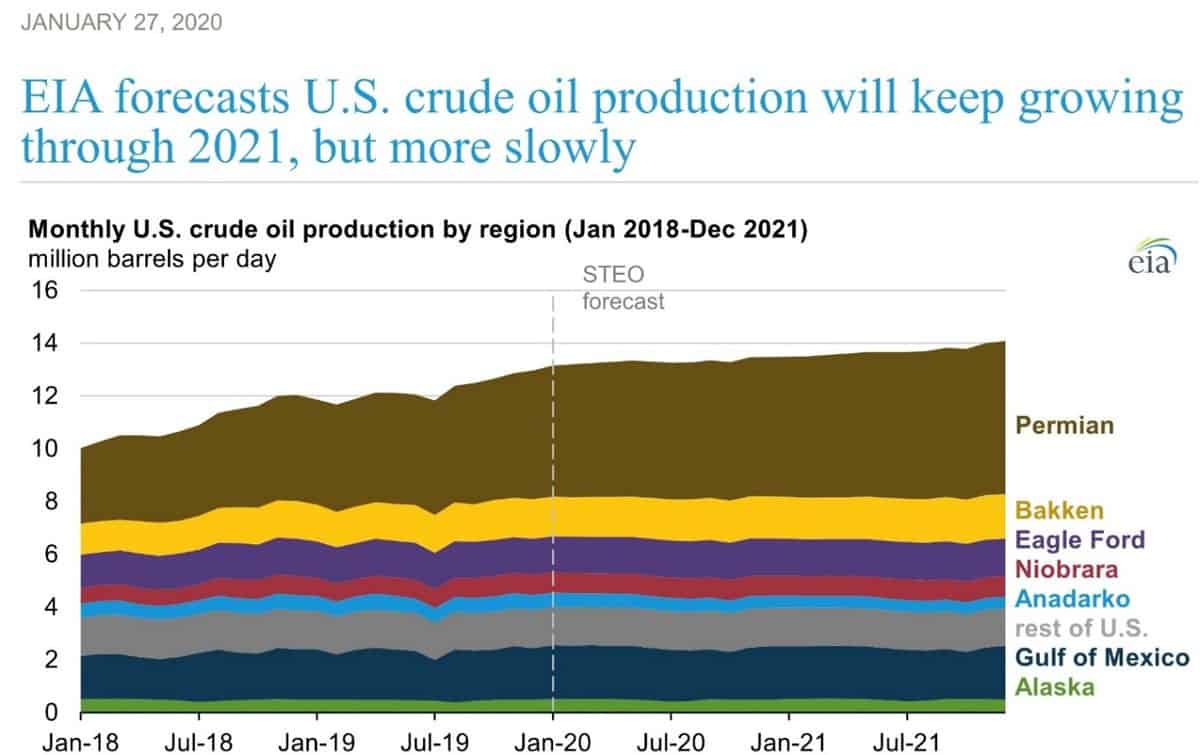
Now during April 2020, oil production that depends upon rail movement is dropping. The year-over-year decline is noticed in the oil rigs counts.
North American Oil Rig Count – mid-March 2020 estimate
| Count | Change from 2019 | |
| USA | 728 | -278 |
| Canada | 54 | -34 |
Based on the drop in the number of rigs, the U.S. energy forecast for 2021 will be much lower.

Agricultural tank car demand

Railroad tank cars are used to move grain-based energy (ethanol). Ethanol is a substitute for methyl tertiary butyl ether (MTBE), an additive that was banned from U.S. gasoline back in 2006. Railroads move more than 60% of the U.S. ethanol traffic.
Prospects for ethanol growth looked good going into 2020. However, as March 2020 ended, selective sources report that corn futures have declined by almost 10%. With fewer miles being driven by autos during the coronavirus event, there are suggestions that ethanol production may fall by as much as 20 to 25% into the second quarter.
There is a market niche upside for industrial alcohol to support the sanitizer market. That niche might support half of the fuel additive volume loss.
Capital project alerts
Both the petro-chemical industry and the oil industry face capital spending project disruption.
The pace of already planned or even under construction capacity expansion will slow. Phillips, as one example, recently announced that it would defer two large pipeline projects.
Capital expenditure project deferral is a classic response to preserve working capital funds as product sales decline.
One extreme source suggests that as many as one-half to two-thirds of all North American shale oil sector drill rigs might be cut back or shut down into the third quarter of 2020.
It is not a prediction. It’s a strategic contingency outlook.

Market view conclusions
As of early April, that declining market demands support the assumption that there are too many tank cars in the North American carload fleet.
Using Railinc data published in late February 2020, this table identifies the overall tank car fleet of some 432,000 units for liquid transport.
The current fleet size for crude oil is about 28,000 units. The ethanol-related cars total about 36,000 units.

Many of these cars are used for product storage – and not just for movement.
These tank cars are expensive assets. To order 1,000 such railcars represents a capital commitment of $120 million or more.
The life cycle of each tank car is 40 to 50 years. The average life left in the existing tanks car fleet is ~36 years.
It is primarily a leasing business model. Lessors reportedly own ~81% of today’s North American tank cars (compared to lessors owning only 54% of all North American railcars).
The market risks are well known since there are more than 110,000 tank cars in technical storage.
Given the current second and third quarter economic outlook with GDP drops in the 15% to 30% range – a strategic person would logically expect to see some existing backordered tank cars perhaps cancelled with penalty – or renegotiated for a longer delivery date.
That seems prudent. For the moment we should conclude that “uncertainty is the only certainty.”
After a recovery to the economy, there should be a longer-range market improvement.
Over time — “this too will pass.”
“Over time markets will try to return to their “mean.”
But that “mean” might be a lower car fleet number.
Overall, the 10-year indexed tank car market has been at a healthy +3.8% compound annual growth rate, or CAGR (better than the -0.5% CAGR for carloads excluding intermodal since 2010).
Nearby market demand in Mexico might see crude oil plus certain chemicals continue to be imported directly by rail across the USA border even during this 2020 crisis period.
Luck combined with skill can play a role.
But competing against possible $19 to $21 a barrel oil makes it a grim task.
As always, contrary logic is welcomed.


Dhananjay Sawant
Railway Tank Car Market 2020 SWOT Analysis By Major Eminent Vendors: Chongqing ChagnZheng Heavy Industry, Union Tank Car, Trinity Industrie
Railway Tank Car Market Competitive Insights 2020, professional and in-depth study on the Railway Tank Car industry with a focus on the Profit Margin Analysis, Market Value Chain Analysis, Market Entry Strategies, recent developments & their impact on the market, Roadmap of Railway Tank Car Market, Opportunities, Challenges, SWOT analysis, and PESTEL analysis, Market estimates, size, and forecast for product segments from 2020 to 2024. An in-depth analysis of newer growth tactics influenced by the market-leading companies shows the global competitive scale of this market sector.
Get Free Sample Copy of Railway Tank Car Report 2020: http://www.researchreportsinc.com/report-sample/593315
The Major Manufacturers Covered In This Report:
Chongqing ChagnZheng Heavy Industry, Union Tank Car, Trinity Industrie, National Steel Car, American-Rails, Greenbrier, GATX Corporation, Vertex Railcar, American Railcar Industries, TrinityRail Products
Source: https://sciencein.me/2020/04/14/railway-tank-car-market-2020-swot-analysis-by-major-eminent-vendors-chongqing-chagnzheng-heavy-industry-union-tank-car-trinity-industrie/
Matthew Brandley
While most of this article is correct and yes we fo have way to many tanker cars , one thing I have been discussing with my friends has been now making waves. Tanker cars for crude storage. Oil storage in the u s will be gull in about 2 months vlcc are already sitting full all over the world. If these tanker cars can be pulled out of storage. Filled. Stoered at a secure site with fire proe and secue, , its a win. Also you left out 2 ethanol plants where shut down last week