FreightWaves features Market Voices – a forum for voices with unique knowledge of numerous transportation/logistics/supply chain sectors, as well as other critical expertise.
Hypothesis – to improve customer service and logistics confidence, key performance indicators, or KPIs, will eventually displace a railroad’s operating ratio (OR) as the preferred management tool.
Shippers will then likely increase their confidence in rail as a transport supplier.
Here is the what and the why as to this market assumption.
A company’s KPIs set a clear benchmark of what its customers can expect. KPIs are not vague measures. They need to be precisely defined. They cannot just be a marketing phrase.
Financially, one KPI is the cash flow result. It is often stated as earnings before interest, tax, depreciation and amortization, or EBITDA.
To a manufacturer, its KPIs include:
- Measured output units
- Downtime
- Operating rates by equipment type
- Labor and equipment revenue output/productivity
- Operating margin
- Cash flow
KPIs publicly define a business. KPIs signal when an organization has or does not have a competitive offering in its markets that is sustainable.

There are about a half dozen popular railroad sector efficiency measures cited in North American public relations statements and the media. Here are the top six according to many:
- The OR is derived from the operating expenses divided by operating revenues
- Free cash flow is what is left over after covering operating expenses and capital expenditures, or CapEx
- Stock value price growth defined as the earnings per share (EPS) growth rate
- Freight cars online (where ironically fewer potential revenue-generating railcars is better)
- Average train speeds across the network between major yards
- Average hours spent in a major railway yard by loaded cars
Here is the problem in translating the railway KPIs above into something that captures the interest of logisticians who have a choice between rail and truck movement.
These popular railway KPIs don’t capture the fundamentals of service quality. Why is that important? Because service performance is what the railroads need to sell in competition with other modes of transportation.
For railroad investors the current KPIs also miss what could mark upside rail freight growth. That’s important because once market top line units and railway market share stop growing, the strategic outlook of the rail freight enterprise becomes questionable.
Investors eventually think about a top valuation selling point once they detect a loss of volume or a significant market share drop against the following KPIs:
- A competitive market price compression perceived against trucking cost improvements
- A margin per car unit drop
Or if they see a financial drop that results in:
- A significantly lower or negative EPS pattern
- A lower return on invested balance sheet capital

What’s a superior set of rail freight KPIs?
Ironically, if we search for critical rail freight logistics performance measures beyond those currently pitched by the North American railroads, one of the innovative management approaches comes from a blending of American and Brazilian railroad management processes.
One railroad group developed a new series of rail freight KPIs after a series of intense discussions with the late head of Canadian National, E. Hunter Harrison. Yes, that is the same Hunter Harrison of precision scheduled railroading fame.
Rolled out initially by América Latina Logística (operating now under the name Rumo) these KPIs are asset-intensity focused.
What is their most critical rail freight asset? It is the freight car.
The business hypothesis is that the missing North American market opportunity is to increase the utilization of the one asset that can significantly increase units of volume, market share and revenue – all calculated on a per car unit basis.
Rumo’s KPIs focus upon:
- Revenue per available railcar
- Loaded railcar miles and increased railcar loads per car time
- Margin per freight car
- Cash flow or EBITDA per car
- Improved dispatcher efficiency originating trains and passing through bottlenecks.
Add to these a few metrics that capture estimated time of arrival/actual final delivery to the customer gives a much more engineered look at the critical measures that do improve customer service.
Taken to the next benchmarking level, this kind of KPIs should generate more customer confidence in using rail freight.
These measures, once achieved and then reported, should capture the market attention of both customers and investors.
Investors and railroad boards of directors would be satisfied because these new KPIs still capture efficiency of assets against calculated cash flow.
These added kinds of delivered service KPIs also ought to capture the analytical attention of policy and regulatory officials who need to ask what the services offerings of high
OR-performing railroads mean or don’t mean to the shipping customers.
The current Surface Transportation Board (STB) should reconsider its current approved checklist of KPIs. They are not particularly informative in today’s complex logistics multi-mode world. By adapting to the logistics environment, the STB could then provide a much more informative service delivery scorecard.

Conclusion
Yes, there is an upside to rail freight improvement. The current anemic critical performance indicators need upgrading.
Core railcar asset load-to-next-load cycles are not increasing at a pace that captures the attention of logisticians choosing transportation modes.
Railroads still haven’t provided direct evidence of shipper benefits with their financial model KPIs.
Low-hanging cost-cutting fruit by PSR managers has been captured by the railroads. Those benefits have been passed along to investors of record.
What’s the next step?
What’s the KPI scorecard measure for PSR phase two and phase three that is going to capture new volumes and higher cash flows? A clear sign of improvement would be significantly more loaded railcar moves per year from the existing baseline fleet.
Storing cars instead of adding more revenue isn’t necessarily a positive market improvement. It signals instead a shrinkage of the asset base available to seek new business. There needs to be a balance.
Now, after satisfying their investors, railroads need to improve the KPIs that matter most to their freight customers. Peter Drucker’s statement has relevance in this case. “Because what gets measured gets done.”
Using the existing freight car fleet (including stored cars) to effectively load more loads per year should increase both volume and revenue – yielding better cash flow. This could be the growth side of PSR.
What do you think the KPIs should be? Are you commercially satisfied with today’s scorecard?
Please, share your contrarian views and logic.
Please remember that my interpretation and conclusions might differ from those of the market sources I need to acknowledge in researching this commentary. Those sources include:
- Kant Rao, PhD from MIT, and former professor at Penn State business school
- Dick Andino and Rick Hill, previously with APL and Amtech Logistics
- Will Allen, former international logistics/operational consultant
- Carlos Henrique Correa (Kiko) at Alta Rail Technologies


Fred Stiening
But today’s railroads are not in the business of owning railcars, and increasingly so as boxcars hit end of life.
Watching trains for a month going on the La Plata Missouri BNSF mainline via the Virtual Railfan camera, this is what you see (stipulating that car mixtures will vary by location and time of year)
Z trains at 70 mph carrying UPS trailers, FedEx, YRC, refrigerated containers, and increasingly Amazon trailers
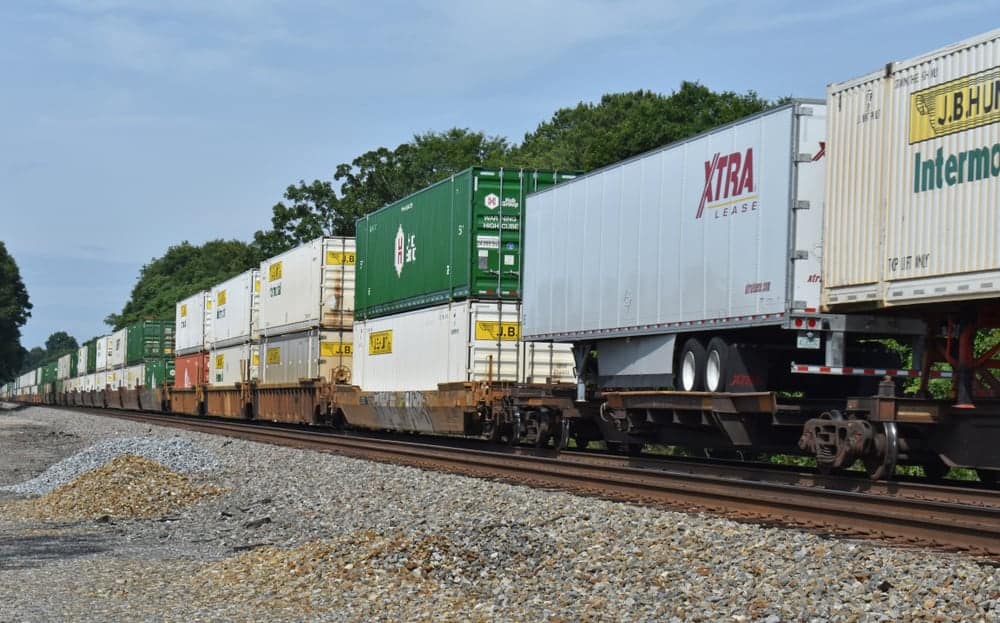
Domestic container / trailer trains (JB Hunt, Swift, Schneider)
Maritime containers (Maersk, MSC, ONE, CMA-CGM)
Unit fracking sand trains
Unit grain trains (probably going to export terminals)
An occasional manifest train carrying loads that can’t be carried practically by trucks – hazardous chemicals, wood products, wind turbine blades, ethanol
Military trains
UP trains with trackage rights
On many of these trains, BNSF owns nothing except the tracks, the locomotives and the employees. Even much of the locomotive fleet is not BNSF – Ferromex, NS, KCS
Back to the earliest days of land grant railroads, owning the tracks and encouraging high volume shippers to locate next to your tracks was a symbiotic relationship. Containers have changed everything – no need to build or operate new spurs into industrial parks, no need for scheduling and operating complex local switching trains that block the mainline, much less need for classification yards
Conrail and Brazil are not the roadmap to the future. Looking at the buildout of NeoPanamax fleets and deals like the CB/CSX tieup for container shipments from Philly / NJ / NY to Montreal and Quebec is the signpost to the future
Steve Murray
A very interesting and salient article. A move to a more asset based KPI scorecard by the railroads would certainly be a step in the right direction, but worry a little that it would be still tangential to actual service performance.
That’s a quibble over details, however, and I very much agree that overall there must be a growth side to PSR. The discussions about that can’t wait any longer, or the assets won’t exist to support that growth.
Peter Vanderzee
Well done Jim. Drucker also said there’s only two value-generating functions within an organization; 1. innovation and 2. marketing.
If an organization is innovative it will develop an increasing number of value generating offerings to its customers. If an organization is top-notch in marketing, it will increasingly drive more customers to use those innovative offerings. Drucker correctly concludes all other corporate functions are merely costs and should be minimized. Seems to me that PSR comes close to that, but being innovative and entrepreneurial is a difficult stretch for many organizations, especially the bigger they get. To fully appreciate that all-too-real conundrum, read “The Innovator’s Dilemma” by Clay Christensen.