


Chart of the Week: Van Contract iniitial reporting of average base rate per mile – USA SONAR: VCRPM1.USA
The average dry van truckload contract rate trend (VCRPM1) has shifted to slight growth (+1.2%) over the past six months. While this seems like a non-event to the uninitiated, it is a rather significant development in the surface transportation market.
Rates are still down 2%-3% from an annual perspective but have grown since Q2, in an environment where they still have every reason to fall.
The contract rates represented in this week’s chart are representative of primarily pricing agreements that last longer than three months between shippers and carriers.
The average length of contracts declined during the pandemic, which is implied with the strong upward and downward trend lines seen from June 2020 into early 2023.
Prior to 2020, truckload contract rate agreements lasted around a year on average before shrinking during the pandemic spending boom. The trend for annual bids has been returning over the past two years as capacity has loosened significantly.
Truckload contracts tend to lose relevance when capacity becomes scarce. Contract rates do not guarantee capacity, just as shippers do not guarantee volume. This is an important concept to understand for the truckload market as the value of service fluctuates wildly at times.
Tender rejection rates measure carrier compliance (or lack thereof) to their contracted customers. Rejection rates increase when capacity tightens. This subsequently pushes rates higher as shippers bid against one another for the available capacity.

National rejection rates (OTRI) below roughly 6%-7% represent a relatively loose environment where trucks are readily available. Contract rates tend to fall in this type of market. Rejection rates have been on a slow climb after bottoming in May 2023 and have broken the 6% threshold only once in the past two years. That occurred this past June/July and lasted about a week, not enough to put any strong pressure on rates.
The current rejection rate level is just above 5%. While this is still a relatively low figure, it is higher than it was at this point last year, when the OTRI was just above 3.5%.
Hurricanes and the ILA strike have helped push rejections higher, but that has been minimal as rejection rates remain below the 6% threshold and were below 5% through most of the past three months.
The big takeaway is that contract rates appear to be feeling the pressure of changing sentiment for the future state of the truckload market, not necessarily that there is a current strong lack of capacity.
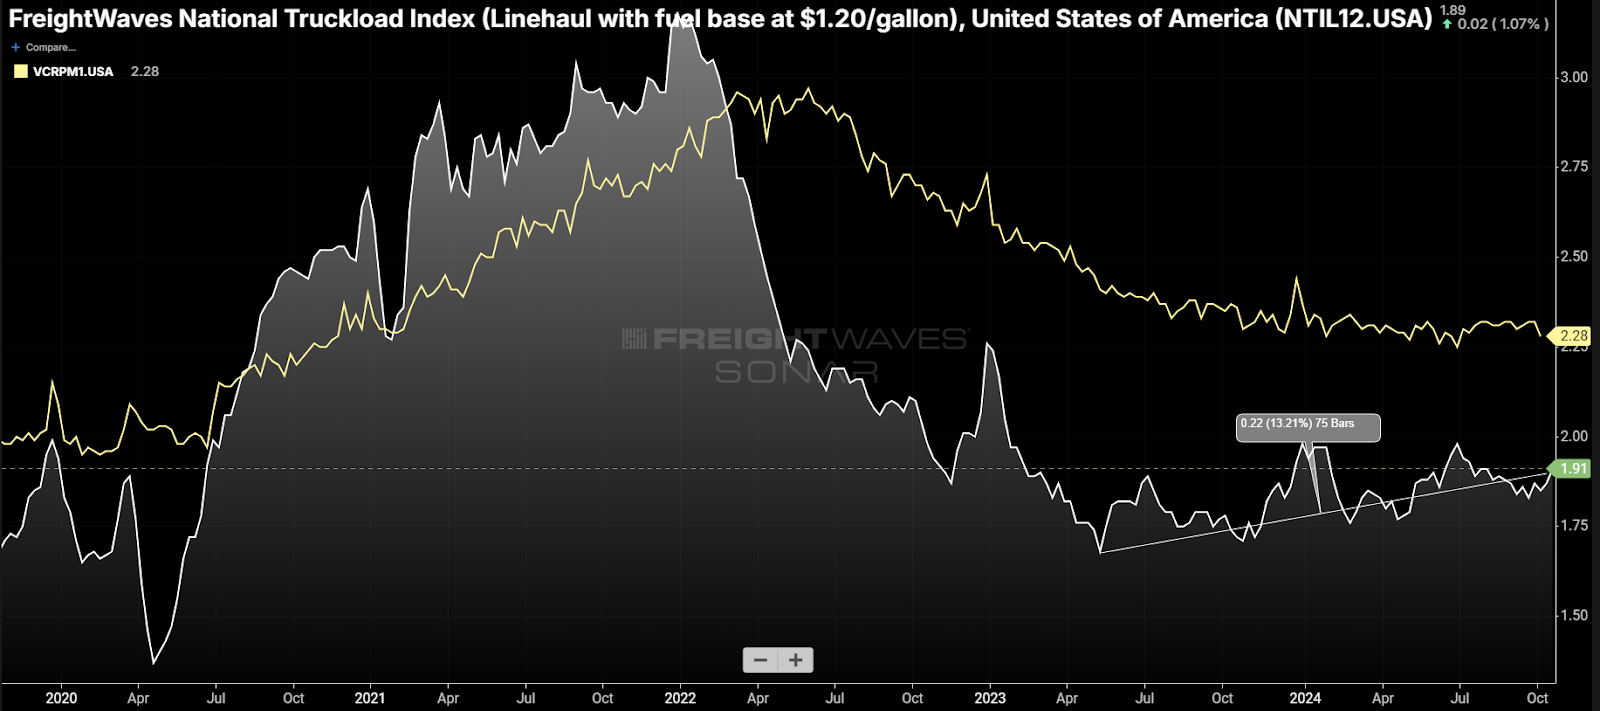
Spot rates excluding a level of fuel cost influence comparable to a standard fuel surcharge implemented for a contract have been on a trend line similar to the OTRI, increasing 13% since May 2023. This trend suggests the floor of the market has been increasing for 18 months but is still well below the carrier-to-shipper contract. The spread is still too large to provide any strong upward push on long-term rates, though the reduction of low-end prices may be helping push the average higher.
Zac Rogers, associate professor of supply chain management at Colorado State University, talked about the forward-looking component of the Logistics Managers’ Index (LMI) on Freightonomics a few weeks ago and mentioned that supply chain professionals are expecting a strong shift in the transportation market in the coming year.
The transportation pricing component is projected to increase from 58 to 76 over the next year, according to the survey’s results. This means transportation procurement teams are preparing for very strong tightening by September 2025.
The LMI is a diffusion index based on survey results where values above 50 indicate expansion and values under 50 are indicative of contraction. Values over 70 are strong expansion.
This sentiment is probably helping increase the value of the 12-month-or-longer truckload contract. Shippers who have the low-end rates will be the first to suffer the consequences of a tight market in the form of truckload service failures and the lost revenue that comes with insufficient inventory levels.

It is a well-known fact that capacity is exiting the truckload environment at a rapid pace. Active operating authorities managed by the Federal Motor Carrier Safety Administration have declined 5% over the past year and are expected to seasonally accelerate in the coming months. While this data is lagging, the trend is the important thing to watch.
The truckload market may not have had a strong flip, but it is turning, just slower than many service providers would like.
About the Chart of the Week
The FreightWaves Chart of the Week is a chart selection from SONAR that provides an interesting data point to describe the state of the freight markets. A chart is chosen from thousands of potential charts on SONAR to help participants visualize the freight market in real time. Each week a Market Expert will post a chart, along with commentary, live on the front page. After that, the Chart of the Week will be archived on FreightWaves.com for future reference.
SONAR aggregates data from hundreds of sources, presenting the data in charts and maps and providing commentary on what freight market experts want to know about the industry in real time.
The FreightWaves data science and product teams are releasing new datasets each week and enhancing the client experience.
To request a SONAR demo, click here.