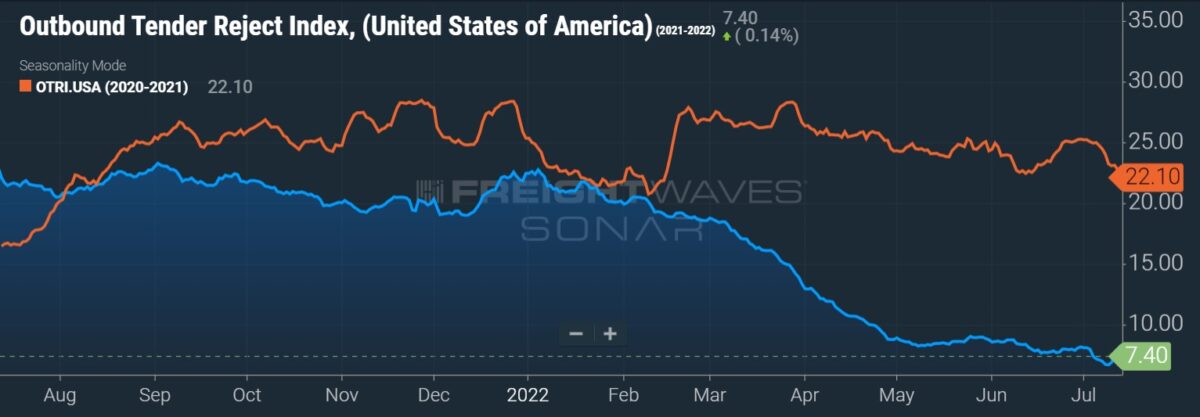
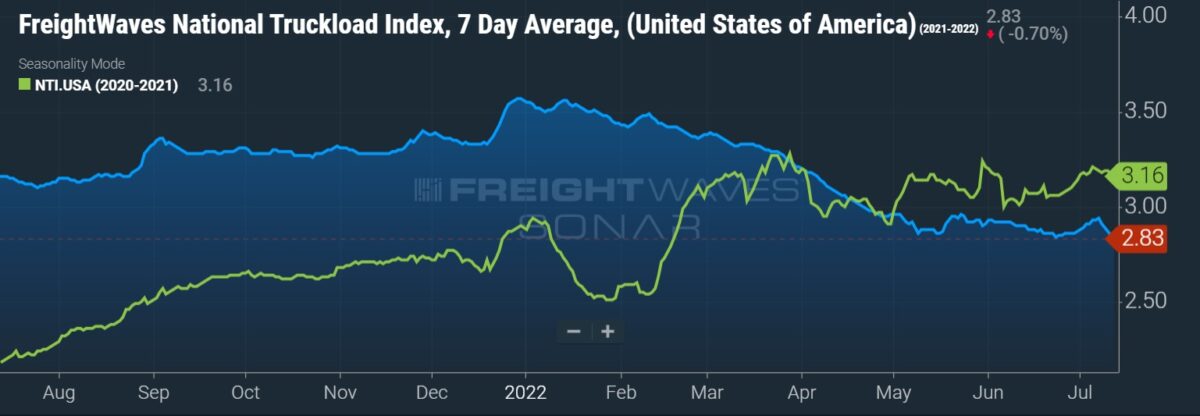
Freight shipments fell 4.1% sequentially in June, reversing all of May’s gain, according to data provided by Cass Information Systems on Wednesday. On a year-over-year comparison, the monthly volumes data set was down for the fourth time in the first half of 2022.
The Cass Freight Index continued to moderate during June alongside macroeconomic data points. With a cooling in consumer spending and new highs in inflation (9.1% annualized, according to June data released by the Bureau of Labor Statistics on Wednesday), the freight industry appears to be on the downside of the freight cycle as the back half of 2022 begins.
Many retailers were chasing inventory throughout the pandemic, often pulling forward merchandise spend well ahead of normal buying patterns to avoid supply chain bottlenecks and ultimately stockouts. However, the trend has reversed course recently with a couple of retail heavyweights signaling margin pressure as they are now carrying too much stock or inventory that is out of season.
“Inventory has shifted from a major tailwind for freight demand to more of a neutral factor currently, with potential to become a considerable headwind if goods demand continues to decline,” ACT Research’s Tim Denoyer stated in the June Cass report.
Cass reported that the shipments index dipped 2.3% y/y in the month, following a 2.7% decline in May. While the index continues to moderate from 2021 levels, it was still 23.9% higher than the level recorded two years ago and 1.9% higher than June of 2019.
Assuming normal seasonality holds in the back half of the year, the shipments index is forecast to see y/y declines of 1% in the third quarter and 5% in the fourth quarter.
| June 2022 | y/y | 2-year | m/m | m/m (SA) |
| Shipments | -2.3% | 23.9% | -2.6% | -4.1% |
| Expenditures | 25.0% | 95.5% | 8.8% | 8.3% |
| TL Linehaul Index | 11.6% | 27.8% | -1.8% | NM |
Freight costs hit all-time high
The expenditures index reached an all-time high in June, jumping 8.3% from May on a seasonally adjusted comparison. The index measures the total amount spent on freight.
Inferred rates, or expenditures divided by shipments, were up 11.7% in June, wiping out the 9.8% sequential decline seen in May. Mix had a big influence in the month as higher-priced truckload shipments accounted for a larger portion of total shipments. Less-than-truckload volumes were a smaller percentage of the freight mix.
The expenditures index was also 25% higher y/y and 95.5% higher than June of 2020. The report estimates that roughly 10 percentage points of the y/y change was tied to higher diesel fuel prices.
LTL rates were up sequentially in June by an undisclosed amount.
Denoyer said normal seasonality will likely keep the index in positive territory through the end of the year, with December logging only a 2% y/y increase. The data set was up 32% in the first half of 2022 compared to the same period in 2021.
The TL linehaul index, which excludes fuel and accessorial surcharges, fell 1.8% from May. However, the index was 11.6% higher than June of last year and 27.8% higher than June of 2020.
“After an extraordinary truckload rate cycle, the market balance has shifted, with capacity now growing briskly and demand falling, which will limit further upside in the Cass Truckload Linehaul Index and likely press it lower in the coming months,” Denoyer said.
The y/y increase in the linehaul index during June was the lowest this year but in line with the average of increases reported throughout 2021.
Even as the market has loosened and spot rates have dropped in recent months, many large carriers have indicated that contractual rate increases continue to come in above inflation and the industry’s higher cost profile. A better indication of contractual negotiations will come later this month when the public fleets report second-quarter results.


Morgan Stanley survey sees ‘tumultuous times ahead’
Results from a Morgan Stanley (NYSE: MS) sentiment survey released Wednesday showed that expectations around TL supply, demand and rates continue to signal a weakening freight market.
“While the extent of the decline signals something more than just a ‘normal’ destocking-driven transportation slowdown (i.e. 2019) but less than a broad recession (i.e. 2008/09), as one broker put it, we expect ‘tumultuous times ahead’ either way and look to next quarter for more definitive signs of its ultimate magnitude,” analyst Ravi Shanker commented in the report.
A recent shipper survey conducted by the firm registered the fourth-lowest economic outlook from respondents in the 20-year history of the data.
Data used in the Cass indexes is derived from freight bills paid by Cass (NASDAQ: CASS), a provider of payment management solutions. Cass processes $37 billion in freight payables annually on behalf of customers.


