So many of the questions and concerns about the economy that are regularly voiced by the media, and routinely parroted by individuals, are expressions of fear that are not rooted in any fundamental data, or at least not any serious study of the fundamental data. As a result, it is easy to oscillate between incredibly frustrated and extremely amused when trying to answer their questions about the economy. To make rational sense of these questions, it is useful to segregate the economy into three parts: technology, consumer and industrial; and then further separate it into domestic and international. Using this construct allows us all to have a clear dissection of the concerns and the data.
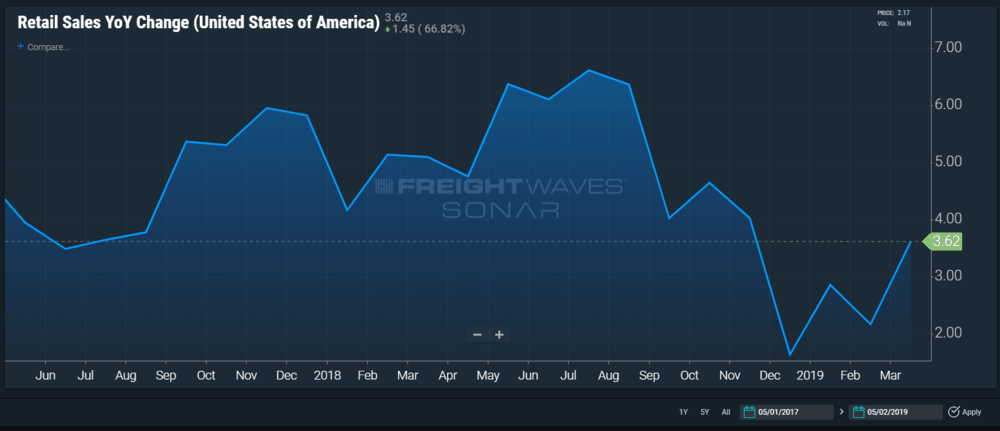
As is often the process when studying anything economic, almost all (if not all) of the variables are dependent (or interdependent). Following my commentary last week on the Industrial Economy, I will endeavor to clearly outline what is happening in the Consumer Economy. The Retail Sales year-over-year change data, available on FreightWaves SONAR under the symbol RESLG.USA, is a great place to start when assessing the strength of the U.S. Consumer Economy. In one simple graph, it provides a regular update on whether consumers are spending more or less. Obviously, there are many more factors to consider: what are they spending (or not spending) their money on; how are they choosing to spend it; and how are those services or goods going to be delivered. All of these factors are changing, but thoughtful analysis of all the underlying trends should start with the big picture, i.e., are they spending more or less?
 Freightwaves sonar
In 2018 the growth in the consumer segment was so strong, coupled with strong surge in the industrial economy, the rate of expansion was straining the infrastructure, especially in transportation, to such an extent that there were substantial signals of material amounts of inflation being produced (albeit, signals that later proved to be false positives, but signals nevertheless). Federal Reserve policy decisions and the bond market took those signals seriously, as the Fed raised rates three times and the rates on the 10-year Treasury rose from under 2.1 percent in August 2017 to as high as 3.25 percent in October 2018. With such strength as a backdrop and with the ebb in the rate of growth experienced this winter, it would be easy to misdiagnose the current U.S. economy as less healthy than it actually is, especially when only looking at the current rate of percentage change versus the rate of percentage change at this time last year.
Nevertheless, unemployment has stayed low and even trended lower (UEMP.USA). That data, as well as many other employment/wage data series are on SONAR under “Macro Economic Indicators,” found by just clicking on the “Enter Symbol” field of a chart when it is empty, and scrolling down. Unlike the ISM Index, we find no value to consumer sentiment surveys. Consumers don’t spend sentiment – they spend income, and as long as unemployment stays low or trends lower, there should be steady wage growth, which drives steady growth in consumer income, which results in steady growth in consumer spending. What and how consumers spend it is another matter, but if their income grows, so will their spending.
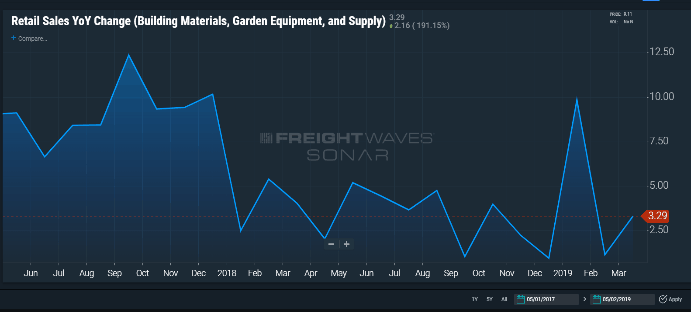
How are consumers spending their income? The SONAR platform allows users to quickly and easily further assess trends in retail sales by segregating the retail sales data into 15 segments. Large trucking companies or third-party logistics firms working with Lowe’s or Home Depot might find the RESLG.BLDG (Retail Sales Building Materials, Garden Equipment, and Supply) chart helpful, while those working with Coca-Cola or Pepsi might find the RESLG.FBEV (Retail Sales Food and Beverage) chart helpful. Large trucking companies and third-party logistics providers for Walgreen’s or Kimberly-Clark might find the RESLG.HPCS (Retail Sales Health and Personal Care Stores) chart helpful, and those working with Amazon or Walmart.com might find the RESLG.ONLN (Retail Sales Electronic Shopping and Mail-Order Houses) chart helpful.
 freightwaves sonar
No matter how you want to slice it, it is clear that the consumer economy is growing, albeit to varying degrees, at steady and sustained rates.
Where are we in the cycle?
Obviously, this isn’t the beginning of the recovery with the economy just starting to climb out of the recession as it was in 2010 and 2011, but with the ‘mini-recession’ of the industrial economy just ending in the fall of 2016, we aren’t into the mature years of the industrial cycle. Since the consumer really didn’t recover from the 2009 recession and spent almost six years in a slow growth/no growth mode, it certainly isn’t in mature years of the consumer cycle either. But for both demographic reasons as well as improved growth in wages, the consumer economy has been expanding at a faster pace since early 2017. To use a baseball analogy, not the first three innings of the game, but not the last couple of innings either.


