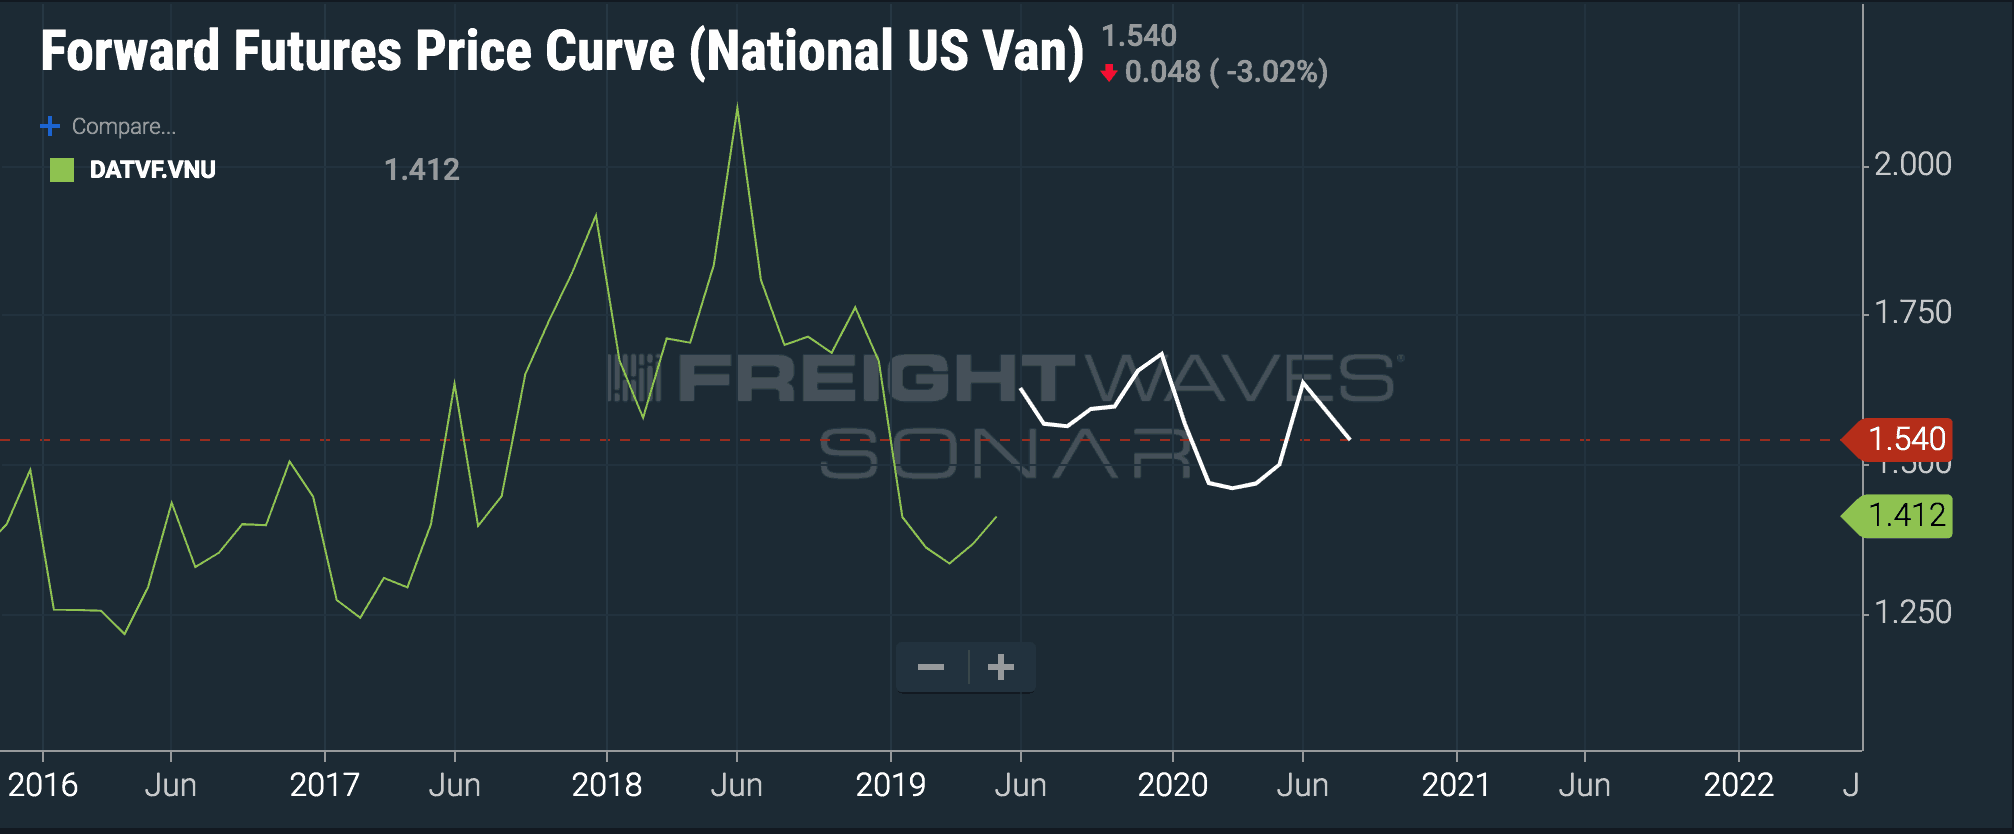
The trucking freight futures market traded on the Nodal Exchange expects a modestly strengthening price environment for the rest of the year. The forward curve, which charts the price of monthly trucking freight futures contracts expiring in the future, indicates that the market expects national average spot rates to stay above 2016 levels for the rest of the year, although upside volatility will not reach the peaks of 2017.
June contracts are priced at $1.59 per mile, implying a significant bump up from current spot rates at $1.41/mile. That’s consistent with the traditional volume and price run-up seen most years in May and June.

Historical DAT rate data – again, national average spot rates for dry vans – are represented by the green line, while the trucking freight futures forward curve is represented by the white line. At this point, the market expects a return to the relatively normal price conditions preceding the capacity-constrained environment of 2017-8.
“There was a bounce from May to June,” said Tom Mallon, Vice President of Financial & Freight Futures Markets at FreightWaves. “The market looks flat into the third quarter with a seasonal bounce again at year’s end.”
The sentiment of the Trucking Freight Futures market is of course only one data point that should be considered by shippers, carriers and brokers.
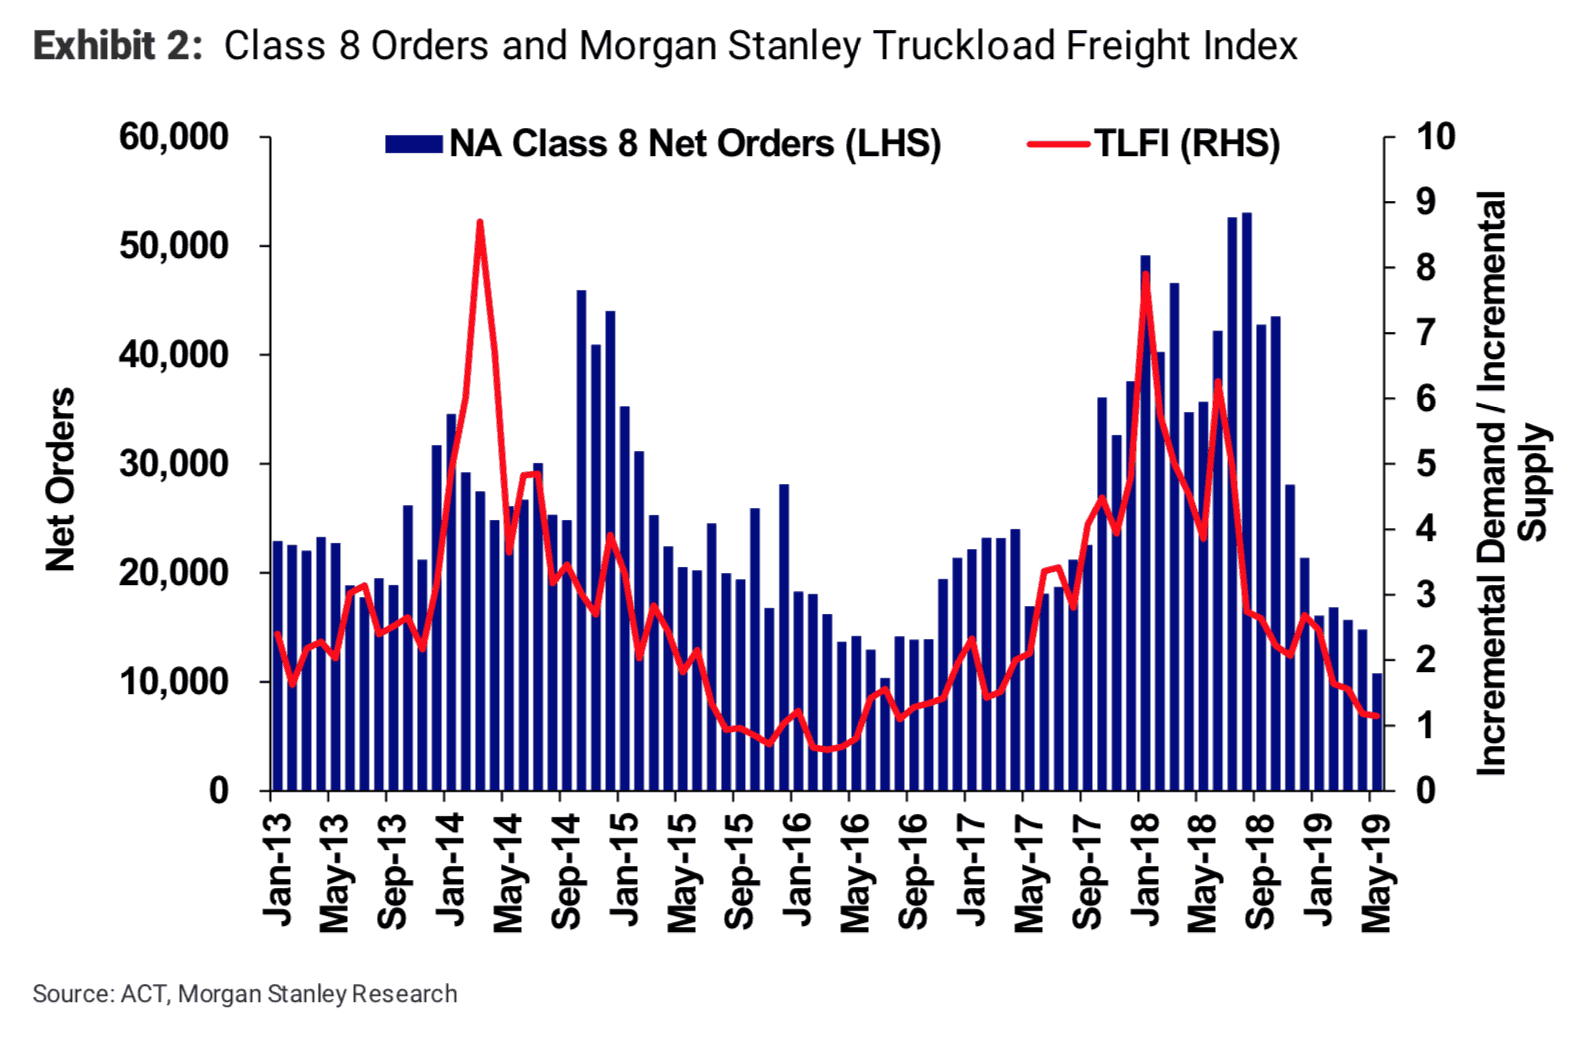
Morgan Stanley equities analyst Ravi Shanker released a note earlier today (June 10) that suggested its proprietary industry metric, the Truckload Freight Index (TLFI) may be near its bottom as orders for new Class 8 trucks crash and a steady clip of carrier bankruptcies bleeds capacity from the market.
“While we will keep an eye on a demand recovery (which has been a primary driver of the industry weakness in the last nine months – see our industry downgrade from October), we expect to see the supply side supportive of rates, especially with the recent sharp decline in new truck orders,” Shanker wrote.

Note that the troughs in Morgan Stanley’s TFLI can last for several quarters, as happened during the freight recession of 2015-16. The question is whether this June looks like June 2015, which slid further down, or June 2016, which saw strength return to freight markets. Positive movement in Morgan Stanley’s model likely depends on continued pain for truckload carriers and even more capacity to leave the market as well as new truck orders to stay depressed for the remainder of 2019.
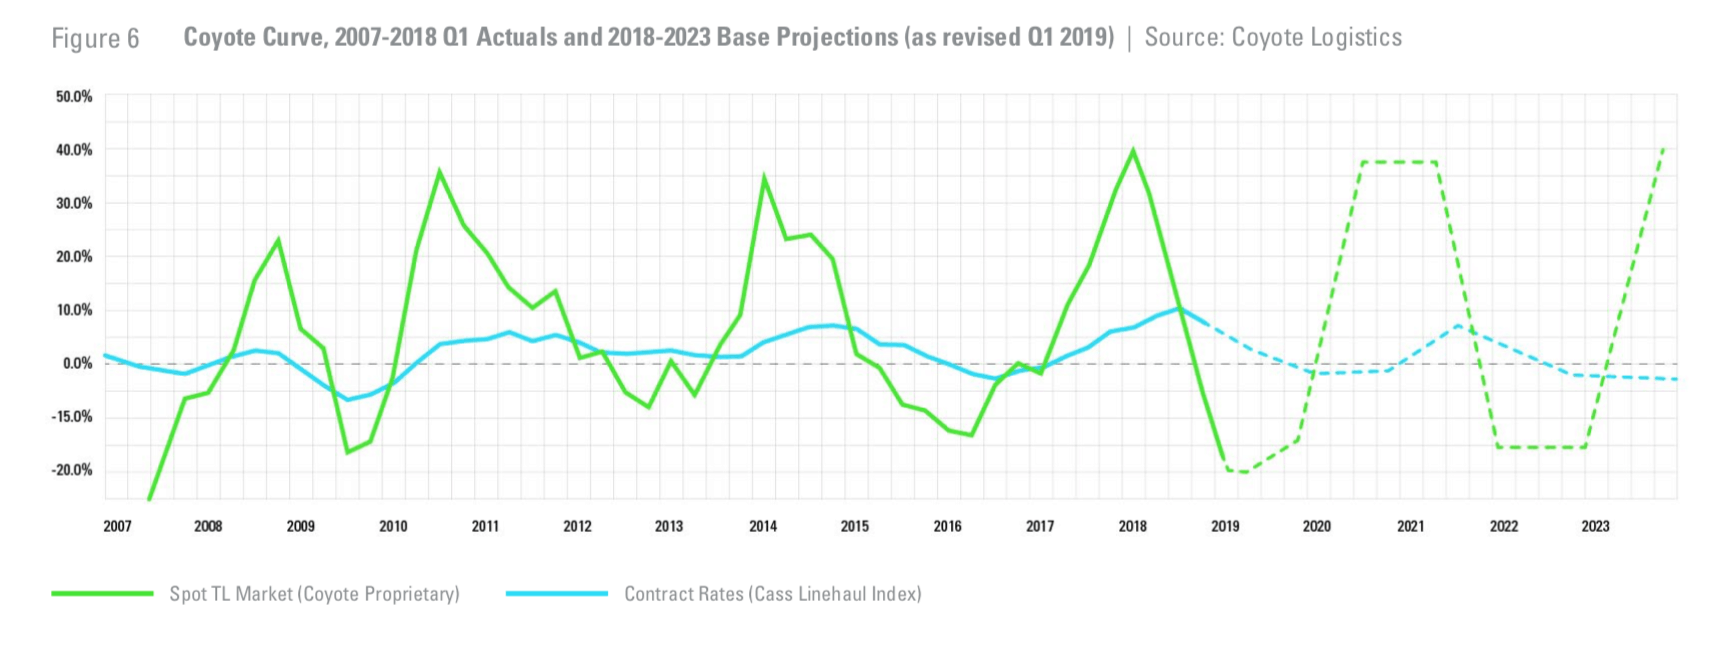
Coyote Logistics’ model, the Coyote Curve, is more bearish on the 2019 outlook for truckload spot rates. Essentially, Coyote expects a deep trough to persist for the rest of the year – with perhaps a modest inflection point upward this quarter – before an inflationary environment resumes in 2020. Conditions should steadily improve until spot markets break into positive growth next year.
“If the current cycle is at least similar to the last three, we could expect a return to market equilibrium, followed by year-over-year spot rate inflation about three quarters after the inflection point (plus or minus a quarter),” wrote Chris Pickett, chief strategy officer at Coyote. “If we re-draw our original Q1 2018 forecast line given our current position, we still project an inflationary market by 2020, only coming from a deeper 2019 deflationary trough (Figure 6).”

While supply will continue to contract under rate pressure, the other side of the equation – demand for truckload capacity, i.e., freight volumes – has posted some fairly sloppy numbers this year. Coyote pointed out that its demand indicator has fallen to nearly 0 percent year-over-year growth; overall national freight volumes (OTVI.USA) are off about 5.5 percent; macroeconomic data like durable goods orders and manufacturing PMI are less than encouraging. Any meaningful increase in spot markets will, of course, depend on demand as much as supply.
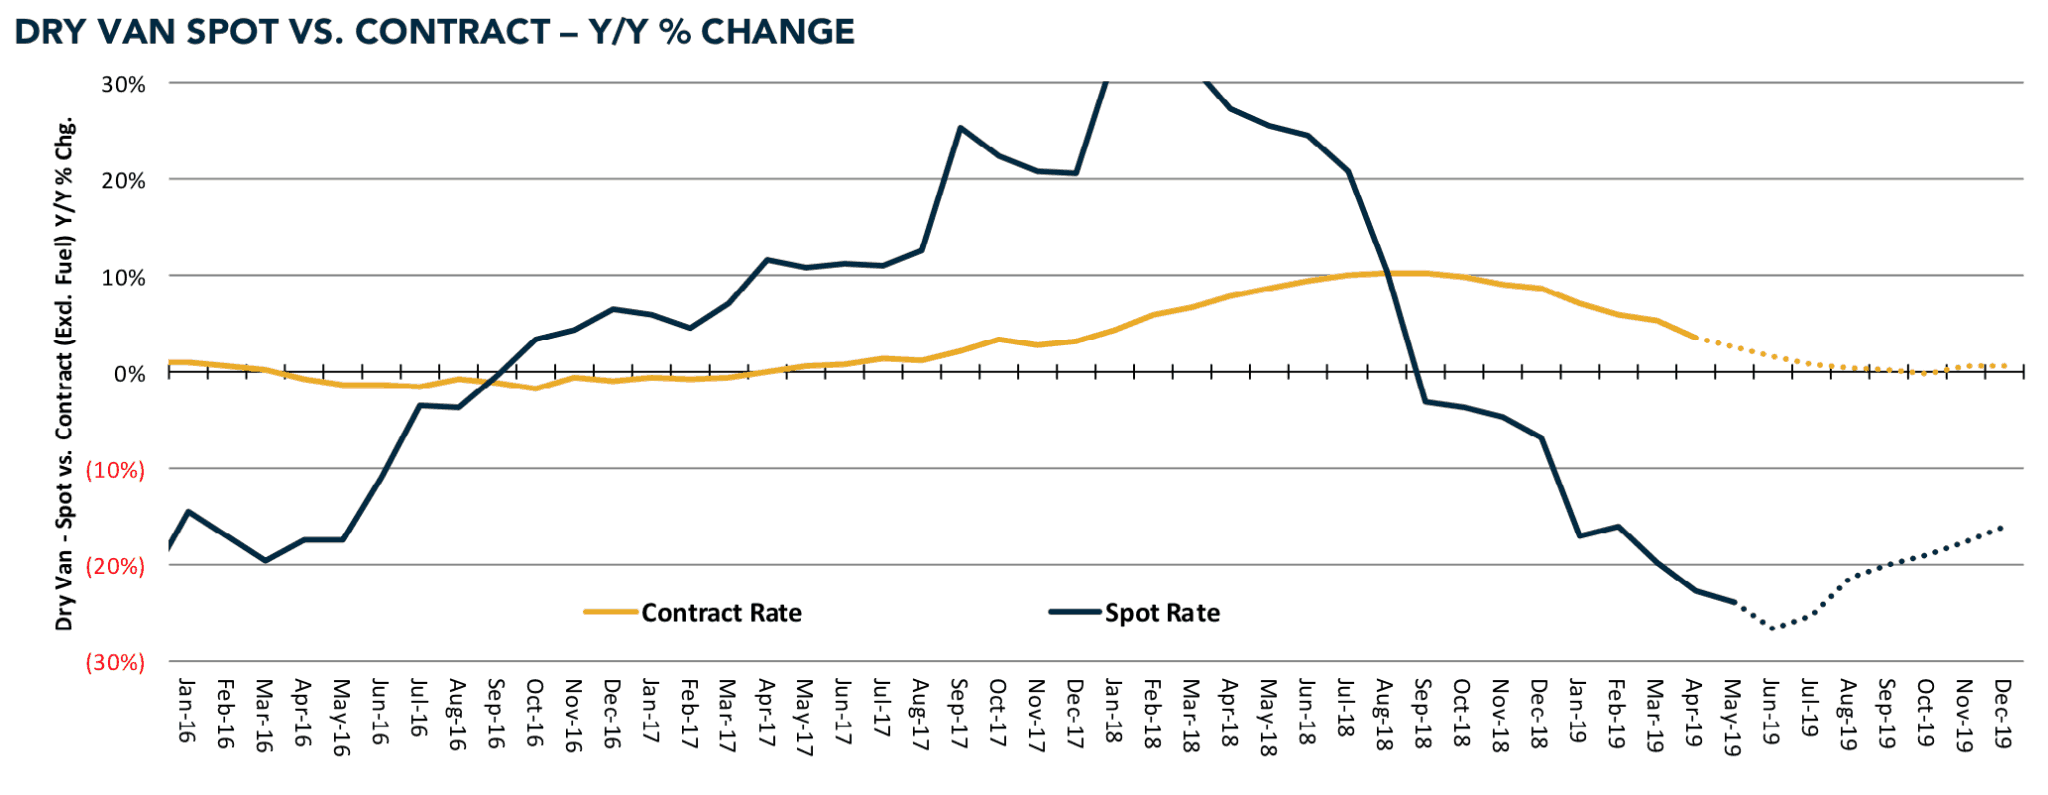
In a recent client note on the railroad industry, Susquehanna equities analyst Bascome Majors highlighted trucking freight markets as a way to help forecast intermodal demand. Majors’ chart projecting contract and spot rates for the rest of the year shows spot rates continuing to underperform year-over-year while finding the market’s bottom and mounting a slow recovery, while contract rates continue to slide to flat year-over-year growth.

“Contrary to contract rates, dry van spot truckload rates (including fuel) have fallen 23.9 percent year-over-year so far in May, worse than April’s -22.7 percent year-over-year and March’s -19.8 percent year-over-year,” Majors wrote. “All-in spot rates have remained under pressure since September of 2018, when they snapped 23 consecutive months of year-over-year increases.”
“Of note, typical seasonality suggests spot rates could be down 20-25 percent year-over-year through 3Q19,” Majors concluded.
It’s important to remember that the way the trucking futures forward curve is priced does not necessarily contradict even Coyote’s more pessimistic outlook. A 13 percent bump in the average rate per mile would be a significant improvement over the current environment, but would still register as negative year-over-year growth compared to the summer of 2018.
By now the theme of gradually tightening supply – both reflected in the falling number of new truck orders and the difficult business environment forcing fleets to shutter their operations – is well-established and will likely continue to play out over the course of the year.
The biggest wild card is macroeconomic demand for truckload capacity – freight volumes.
At the moment, it appears that uncertainty around trade policy is forcing businesses to be cautious about investment and supply chain design. The passage and ratification of the USMCA, the ‘new NAFTA,’ will be a step in the right direction for the business community but its effect on freight demand remains to be seen. President Trump’s decision last weekend to suspend indefinitely tariffs on Mexican goods is certainly a positive for growth and volumes.
Debt markets are pricing in several cuts to the Fed funds rate this year, which, if they come through, will have the effect of lowering interest rates and easing the supply of money. In theory, that should be positive for business investment, capital expenditure and growth, but expect a lag of six to nine months for the effects of those policy decisions to take hold in the economy.
FreightWaves will continue to report on freight markets as data accumulates and the supply/demand situation becomes more clear.


