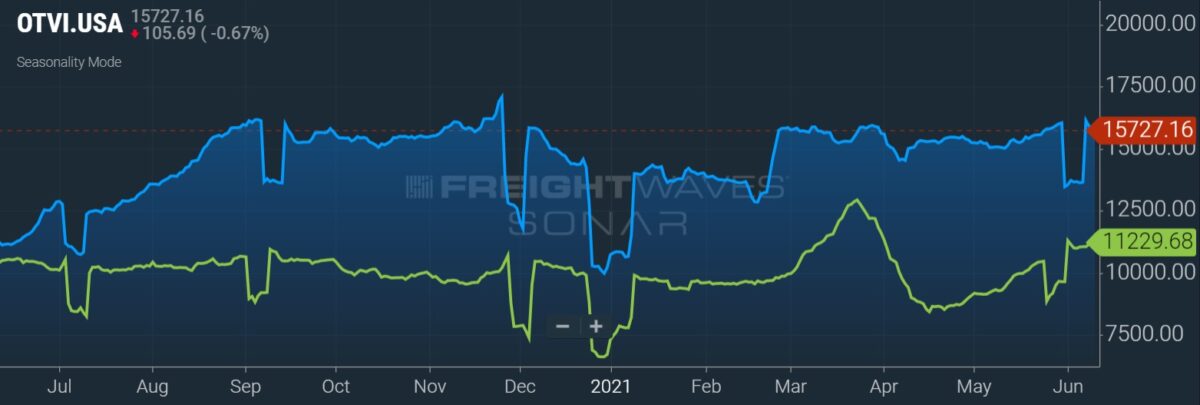
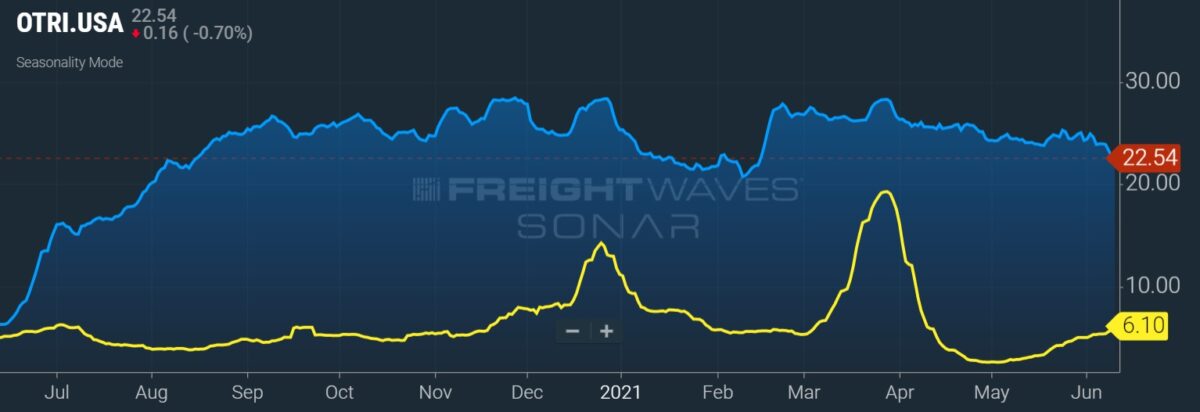
Data released Friday from Cass Information Systems (NASDAQ: CASS) shows the freight industry advanced at a blistering pace during May. The Cass Freight Index logged the highest-ever growth rates in the shipments and expenditures components of the dataset’s more than 30-year history.
The May report showed the shipments index jumped 35.3% higher year-over-year. While the comparisons reflect year-ago demand weakness as large parts of the nation and economy remained under lockdown, the index recorded the highest reading since May 2018.
The two-year stacked comp also turned positive for the first time in the current freight cycle, up 3.3% from May 2019. Recently, many analysts have been comparing freight volumes to the similar period in 2019, which is viewed as a more typical freight market, to remove some of the COVID-related noise in the comps.
The shipments index was up 7.7% compared to April, 5.9% higher sequentially on a seasonally adjusted basis.
Improvements in auto production, a steady offloading of containers at the ports and inventory restocking due to strong retail sales were cited as reasons for the volume increase.

The expenditures component was up 49.9% year-over-year, an acceleration from the 45.1% increase recorded in April. The report noted that the May comp was the easiest of the COVID period and that future comps will get tougher.
But significant slowing will take time.
The report’s author, ACT Research’s Tim Denoyer, said year-over-year growth in June is likely to be around 45% assuming normal seasonality. He expects third-quarter growth to only slow to +30%.
The expenditures index dipped 2.6% from April and was down 4.2% when seasonally adjusted.
Implied freight rates, expenditures divided by shipments, were up 10.8% year-over-year but fell 7.8% seasonally adjusted from April as shipments surged.
“Last month, we discussed our expectation that this series would slow with most annual contract freight having been repriced at this point. However, the significant m/m drop was not likely due to market conditions, which by most accounts, including the Cass Truckload Linehaul Index, continued to increase in May,” Denoyer wrote.
Denoyer said the decline was likely related to changes in modal mix, which resulted in the index backing up sequentially.
Compared to May 2020, the TL Linehaul Index increased 14.1%, a third consecutive record. The index has been up on a month-over-month comparison for 11 straight months, up 1.7% in May.
“With strong freight demand and ongoing supply constraints in both of the critical components of trucking capacity (drivers and tractors), the trend of the Cass Truckload Linehaul Index should remain up and to the right in the near term,” Denoyer added.
Cass’ May trends align with what many trucking executives had to say at recent investor conferences. Collectively, the group sees no letup in demand. They also believe that capacity has likely been structurally altered and will remain an issue much longer than elevated demand lingers.
Robust consumer spending, a hole in inventories that needs to be refilled and a growing need for truck drivers appear to be the catalysts at work for the industry at least through the back half of the year.

“Even with considerable supply constraints, the freight cycle is in high-growth mode. While y/y comparisons will naturally slow going forward, the freight markets continue to benefit from a very strong retail economy, very tight inventories and a backlog of container ships still anchored in the San Pedro Bay,” Denoyer concluded.
Data used in the Cass indexes is derived from freight bills paid by Cass, a provider of payment management solutions. Cass processes $28 billion in freight payables on behalf of more than 8,000 subscribers annually.


lucas
Shippers should definitely be taking advantage of Schneider’s Freight Power Shipper tool for LTL and truckload quotes. Shoot me an email if you need access VandeurzenL@schneider.com