This week’s FreightWaves Supply Chain Pricing Power Index: 45 (Shippers)
Last week’s FreightWaves Supply Chain Pricing Power Index: 45 (Shippers)
Three-month FreightWaves Supply Chain Pricing Power Index Outlook: 40 (Shippers)
The FreightWaves Supply Chain Pricing Power Index uses the analytics and data in FreightWaves SONAR to analyze the market and estimate the negotiating power for rates between shippers and carriers.
The Pricing Power Index is based on the following indicators:
Volumes suffer as major retailers brace for consumer slowdown
In the week following Memorial Day, freight demand rebounded quite strongly to levels not seen since early April. Unfortunately, tender volumes did not carry that momentum into this week, as the Outbound Tender Volume Index (OTVI) has since stalled out. This inertia does not follow historical trends, since the period between Memorial Day and the Fourth of July is typically a strong season for freight.
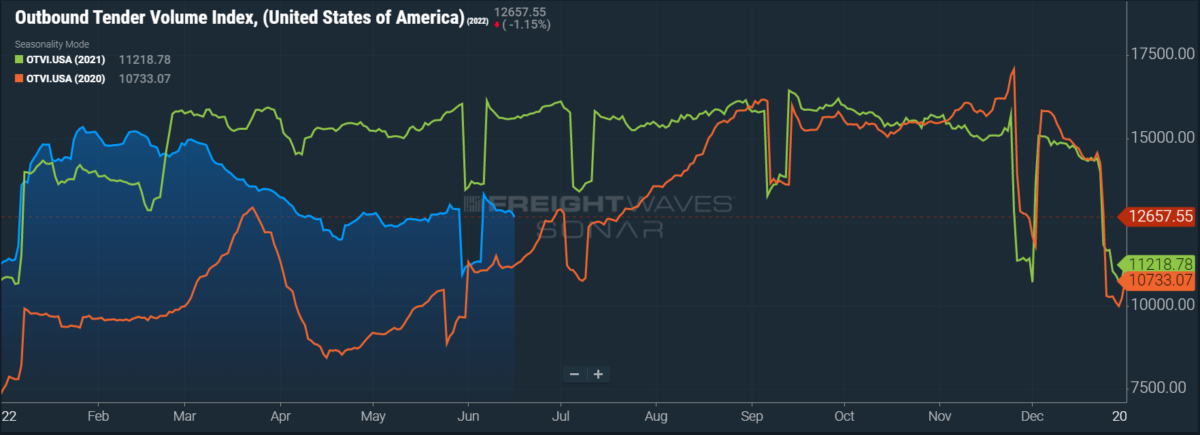
SONAR: OTVI.USA: 2022 (blue), 2021 (green) and 2020 (orange)
To learn more about FreightWaves SONAR, click here.
OTVI fell 2.82% on a week-over-week (w/w) basis, a worrying signal that retailers are anticipating a slowdown in consumer demand as well as reckoning with their current inventory glut. On a year-over-year (y/y) basis, OTVI is down 19.23%, although y/y comparisons can be colored by significant shifts in tender rejections. OTVI, which includes both accepted and rejected tenders, can be artificially inflated by an uptick in the Outbound Tender Reject Index (OTRI).
FreightWaves has released a new data set in SONAR so that users can track the real flow of contracted freight: Contract Loads Accepted Volumes, or CLAV. CLAV is an index that measures accepted load volumes moving under contracted agreements; in short, it is similar to OTVI but without the rejected tenders.
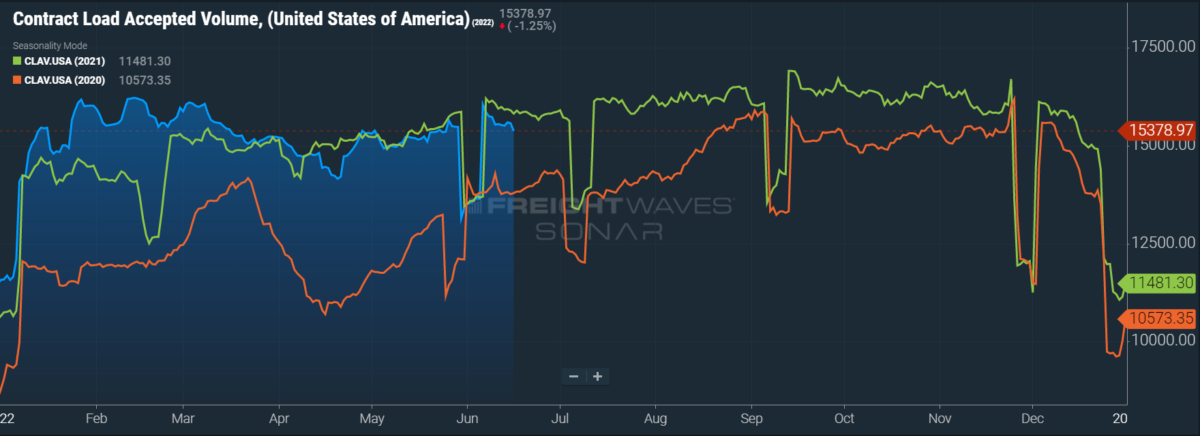
SONAR: CLAV.USA: 2022 (blue), 2021 (green) and 2020 (orange)
To learn more about FreightWaves SONAR, click here.
Looking at accepted tender volumes, then, we see not only an expected dip of 2.26% w/w but also a further dip of 2.8% y/y. This y/y difference confirms that actual cracks in freight demand, and not merely OTRI’s y/y decline, are driving OTVI to lower levels. On a more optimistic note, however, CLAV is up 1.45% month-over-month (m/m). While June should normally be expected to build on May’s freight demand, OTVI has hardly been bound by seasonal trends in the year-to-date, so any good news is news worth celebrating.
Speaking of good news, Port of Los Angeles Executive Director Gene Seroka is optimistic about sustaining high import levels in the months to come. Despite the inflationary pressures facing consumers at the pump and elsewhere, Seroka is confident that “peak cargo season is on its way” as Americans will “continue to buy.” Moreover, Seroka noted no appreciable impact from Shanghai’s COVID lockdowns on import volume, as he states that “the number of ships leaving Asia has been very steady.” Of course, import volumes (especially in the ports of Los Angeles and Long Beach) are major drivers of truckload demand and are thus of special interest to carriers in the region.
This optimistic outlook comes on the heels of the Port of Los Angeles reporting its third-highest month of total throughput. Similarly in May, the nearby Port of Long Beach posted its second-best month and the Port of Charleston — a burgeoning port on the East Coast — reported its third-best month.
Despite these bright spots, there is still cause for concern. Major retailers, including Target, Walmart and Macy’s, have announced excess levels of inventory, particularly for durable goods such as furniture and home appliances. While some retailers, like Target, plan to offer deep discounts in order to clear their back rooms, others might choose to hold onto their excess inventory and wait out the consumer slowdown.
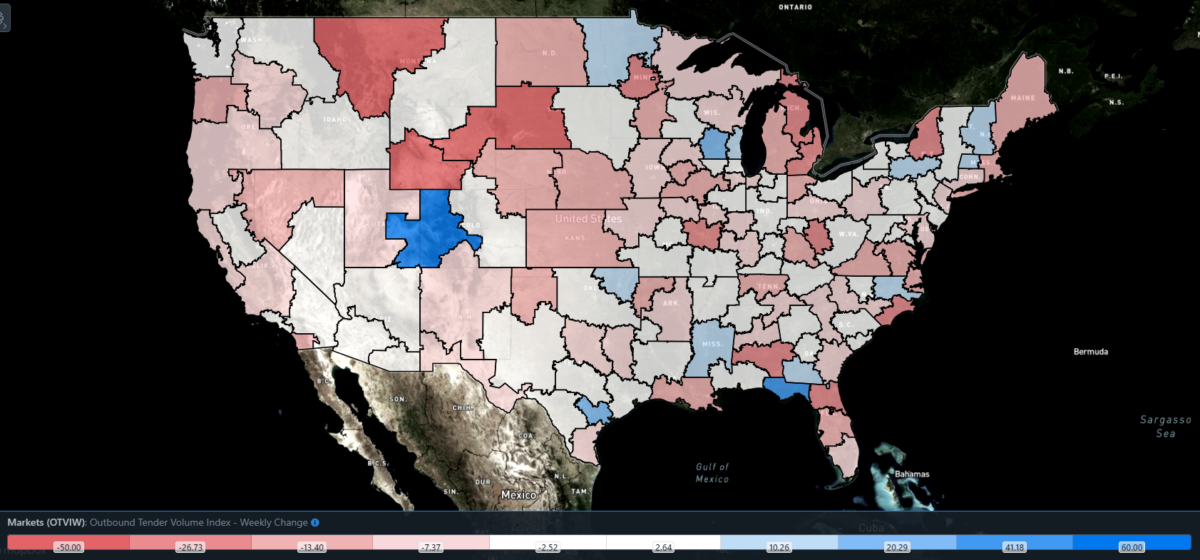
SONAR: Outbound Tender Volume Index – Weekly Change (OTVIW).
To learn more about FreightWaves SONAR, click here.
Of the 135 total markets, only 48 reported weekly increases as freight demand peters out across the nation.
Since the Port of Charleston posted its third-best month in May, which also marked its 14th consecutive month of growth, it should come as no surprise that Charleston, South Carolina, was one of the markets that saw increased freight demand this week. Volumes in Charleston grew 5.66% w/w. Ontario, California, which is one of the largest markets by outbound volume that primarily processes imports from the ports of Los Angeles and Long Beach, saw volumes contract 2.52% w/w.
By mode: Reefer volumes continue to frustrate and confuse. Despite beginning the year at seasonal record highs, it has since become clear that reefers moved most of their freight in the first quarter. The ongoing produce season, a historically busy period for reefers, has failed to budge the needle in any meaningful way, even as produce is one of the major targets of inflation. Nevertheless, the Reefer Outbound Tender Volume Index (ROTVI) is up 2.6% w/w after gains made late in the week.
Likewise, van volumes continue to drive the trends in the overall OTVI, flatlining after last week’s post-holiday recovery. The Van Outbound Tender Volume Index (VOTVI) is down 3.69% w/w as well as 20.18% y/y, though much of both ROTVI and VOTVI’s poor y/y performance can be attributed to declining tender rejections.
Rejection rates finally fall under 8% after months of teasing
It has been a long while since OTRI was at such lows: excepting the start of the 2020 pandemic, OTRI has not fallen under 8% since the tail end of 2019. Over the past few months, OTRI had been bound between 8% and 9%, leading some (including myself) to believe that a new floor had been found for the foreseeable future. Rising costs of operation, including diesel fuel, had provided slim upward pressure on rejection rates while everything else pushed it downward. But it now appears that even these costs cannot bolster OTRI against adverse market conditions.
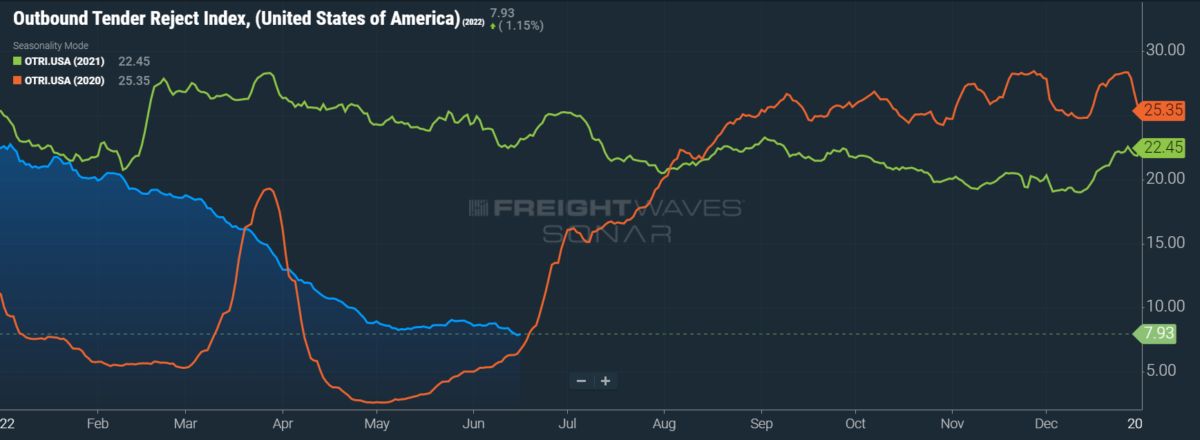
SONAR: OTRI.USA: 2022 (blue), 2021 (green) and 2020 (orange)
To learn more about FreightWaves SONAR, click here.
Over the past week, OTRI, which measures relative capacity in the market, fell to 7.93%, a change of 53 basis points (bps) from the week prior. OTRI is now 1,525 bps below year-ago levels. With this latest barrier broken, OTRI could continue to fall to levels as low as 5%, mirroring the dark days of the 2019 downturn.
Prices of used trucking equipment, which skyrocketed when both freight demand and rates were high (and capacity was low) at the start of the pandemic, are now crashing almost as quickly as they rose. Used truck prices were bolstered not only by the promise of rapidly rising spot rates and volumes, but also by the (still ongoing) semiconductor crisis that hindered production of automobiles and trucks.
Many new entrants into the market decided to swallow the cost of these used trucks, which they figured would be offset by huge gains in carrier rates. The fact that these carriers, which are especially sensitive to shifting market conditions, are now leaving the market and are trying to recoup some of their investment is a worrying signal for freight demand in the coming months.
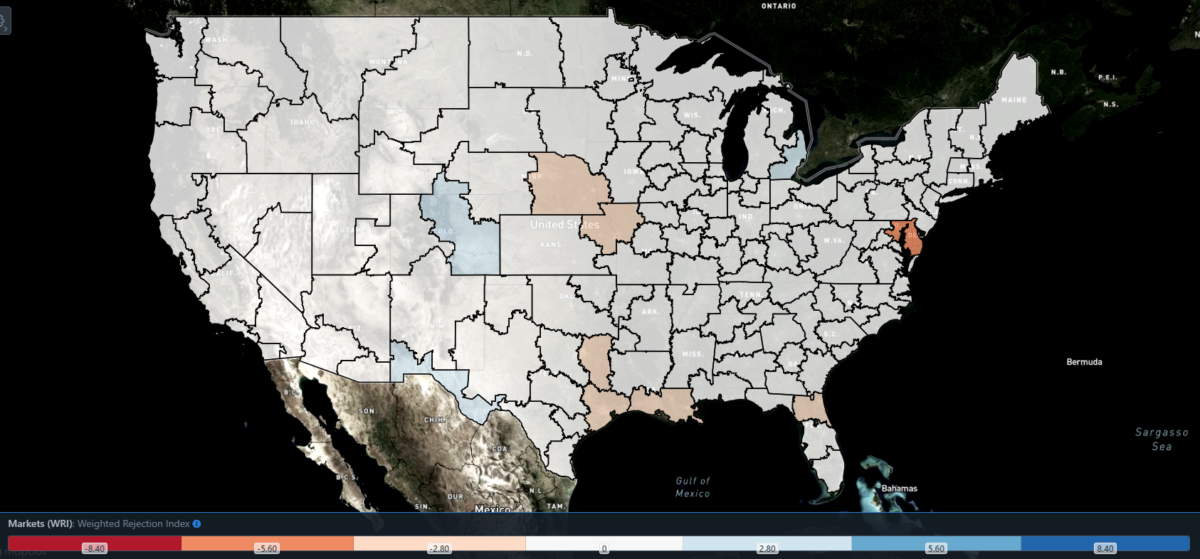
SONAR: WRI (color)
To learn more about FreightWaves SONAR, click here.
The map above shows the Weighted Rejection Index (WRI), the product of the Outbound Tender Reject Index — Weekly Change and Outbound Tender Market Share, as a way to prioritize rejection rate changes. As capacity is generally finding freight, only a few regions this week posted blue markets, which are the ones to focus on.
Of the 135 markets, 54 reported higher rejection rates over the past week as freight demand sputters across the board.
Detroit saw tender rejections jump 260 bps as its local OTRI rose to 6.51%. The bulk of this increase happened on Thursday, when severe thunderstorms rocked southern Michigan along with winds of up to 60 mph. Michigan’s weather has been wildly unpredictable over the past few months, leading to sharper ebbs and flows in tender rejections. This storm should not linger long, however, as sunny weather and high temperatures are expected to clear any flooding that might have occurred.
To learn more about FreightWaves SONAR, click here.
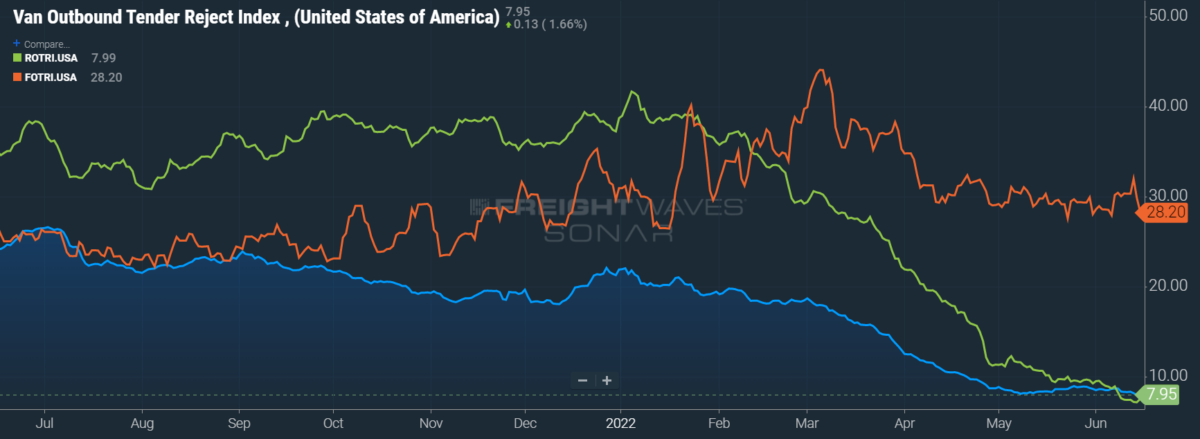
By mode: Flatbed rejection rates spiked to 32% on Monday but fell sharply on the following days. This week, the Flatbed Outbound Tender Reject Index (FOTRI) fell 183 bps to 28.2%. Despite this week’s shock to flatbed rejections, FOTRI is still 162 bps above year-ago levels and is 2,027 bps higher than the overall OTRI.
Even still, flatbeds are not exempt from the gathering economic headwinds. Housing starts fell to their lowest levels in 13 months, which suggests that the red-hot housing market is cooling. That the housing market is cooling should come as little surprise: According to Freddie Mac, the average 30-year fixed rate mortgage rate has risen 267 bps since the start of the year to 5.78%.
Reefers, meanwhile, are posting the lowest rejection rates across all three modes. On Wednesday, the Reefer Outbound Tender Reject Index (ROTRI) threatened to fall below 7%, but bounced back to 8%, marking a rise of 40 bps w/w. The Van Outbound Tender Reject Index (VOTRI) had a drop of 38 bps w/w to 7.95%, close to levels of the overall OTRI.
Spot rates spiraling down to 16-month lows, but contract rates at all-time highs
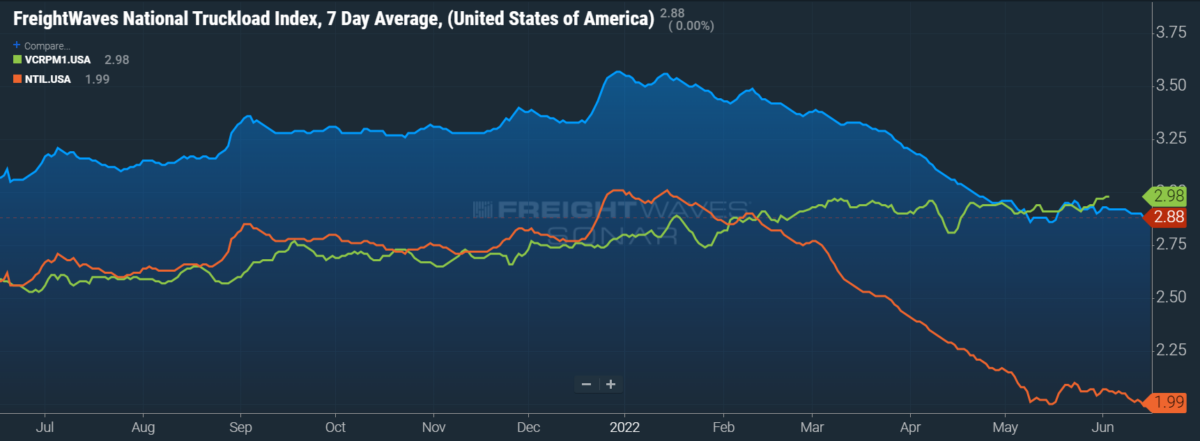
Spot rates are edging closer to their lowest level since February 2021. Even the rising prices of diesel can’t plug the leak in the National Truckload Index (NTI), which is inclusive of fuel. Spot rates are either likely to remain stable or else will continue to drop until the Fourth of July, when some capacity is anticipated to go offline, giving a temporary boost to carrier rates.
SONAR: National Truckload Index, 7-day average (blue), dry van contract rate (green) and National Truckload Index [Linehaul Only] (orange).
To learn more about FreightWaves SONAR, click here.
Over the past week, the NTI has fallen 3 cents per mile to $2.88/mi. In the previous year, spot rates climbed steadily over the summer until they plateaued in September. Needless to say, the present decline in rates is both unseasonable and foreboding.
The NTIL, which is the linehaul rate that removes fuel from the all-in NTI, fell 4 cents per mile to $1.99/mi, indicating that nearly a third of spot rates are going straight to fuel payments. As expected, any changes in the NTI are currently due to declining linehaul rates.
Contract rates, which are base linehaul rates like the NTIL, rose 5 cents per mile to $2.98/mi. Since contract rates are reported on a two-week delay, this uptick in rates corresponds with activity in the week of Memorial Day. Given that the second quarter of 2022 is nearing its end, we can expect to see renegotiations in the weeks to come. These renegotiations, should they take place, will heavily favor shippers; as a result, contract rates should come down from their current highs.
To learn more about FreightWaves SONAR, click here.
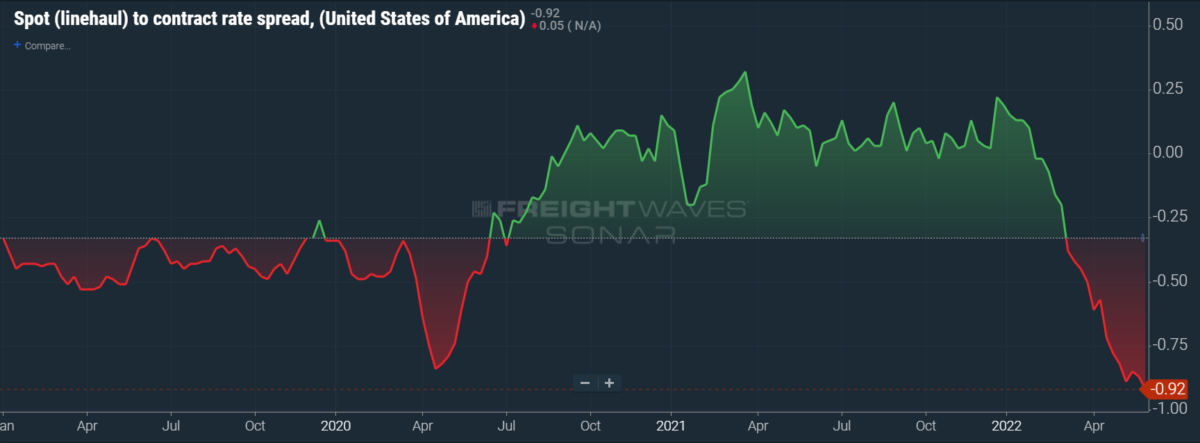
The chart above shows the spread between the NTIL and dry van contract rates. As can be seen, the index has continued to fall to new all-time lows in the data set, which dates back to early 2019. Throughout 2019, contract rates exceeded spot rates, which led to a record number of bankruptcies in the space. Once COVID-19 spread, spot rates reacted quickly, rising to new record highs on a seemingly weekly basis, while contract rates slowly crept higher throughout 2021.
Once spot rates started the rapid descent from the stratosphere in late February, the spread between contract rates and spot rates narrowed as contract rates continued to increase throughout the first quarter. This caused the spread between contract and spot rates to turn negative for the first time since July 2020.
The spread quickly fell to negative 92 cents, where it stands today. The spread being this wide will place downward pressure on contract rates as the calendar turns to the back half of the year.
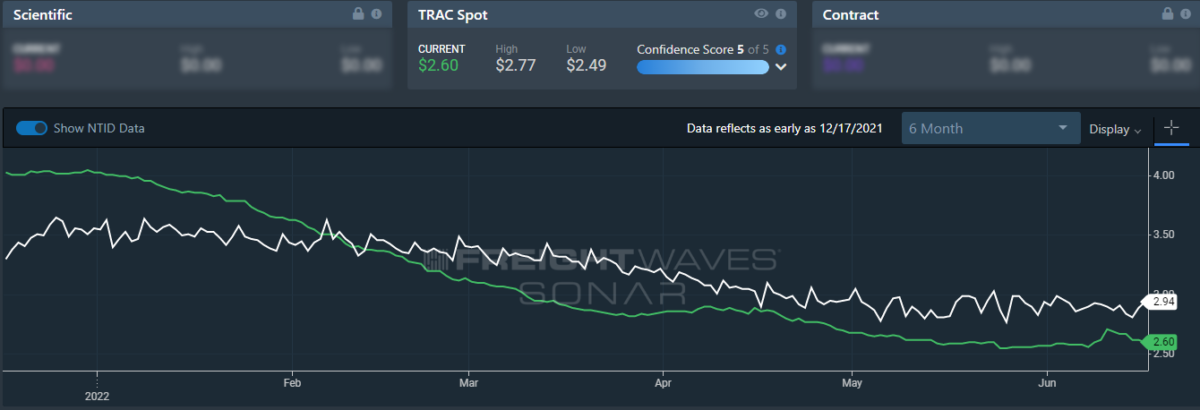
To learn more about FreightWaves TRAC, click here.
The FreightWaves TRAC spot rate from Los Angeles to Dallas, arguably one of the densest freight lanes in the country, did not tip the scales whatsoever. Over the past week, the FreightWaves TRAC spot rate remained unchanged at $2.60/mi. Compared to the NTID, the National Truckload Index – Daily, rates from Los Angeles to Dallas are depressed compared to the national average as expected, but that was not the case at the start of the year. When carriers flooded Southern California in January, they pushed spot rates down rapidly.
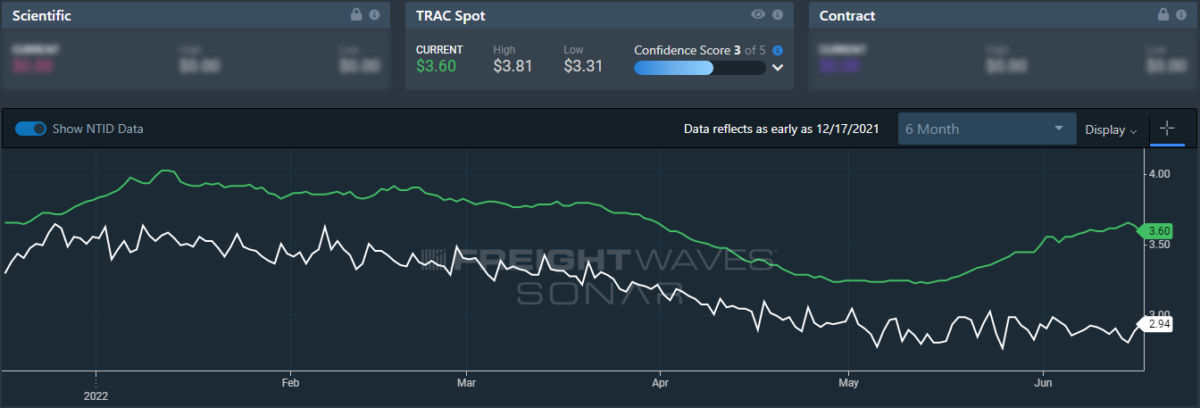
To learn more about FreightWaves TRAC, click here.
On the East Coast, especially out of Atlanta, rates are declining but are still beating the NTID. The FreightWaves TRAC rate from Atlanta to Philadelphia fell 1 cent per mile to $3.60, reversing the previous three weeks’ increases. Carriers are still showing some restraint heading into the Northeast as diesel prices are extremely high and reserve levels are depressed.
For more information on the FreightWaves Passport, please contact Kevin Hill at khill@freightwaves.com, Tony Mulvey at tmulvey@freightwaves.com or Michael Rudolph at mrudolph@freightwaves.com.


