Freight shipments and total freight spend remained under pressure again in May, according to data from Cass Information Systems.
Shipments in May were flat with April but down 5.8% year over year (y/y). The y/y decline was 1.8 percentage points more pronounced than in April, and when adjusting for seasonal trends, the shipments index was off 3.1% sequentially to a 46-month low.
The Monday report noted “ongoing softness in for-hire demand” as loads normally pegged for the for-hire market are being insourced by private carriers. It also said shippers consolidating less-than-truckload shipments into single truckload moves is weighing on the index.
“The Cass data set has considerable LTL mix, and LTL shipments have been consolidated into truckloads at an outsized pace over the past year,” the report said.
The y/y decline in shipments during May was nearly double the drop previously forecast. The index is now expected to decline 4% y/y in June, with a “similar decline for the full year.”
The call issued just two months ago was for the index to turn positive by June.
| May 2024 | y/y | 2-year | m/m | m/m (SA) |
| Shipments | -5.8% | -11.1% | 0.0% | -3.1% |
| Expenditures | -9.0% | -23.3% | 1.9% | 0.8% |
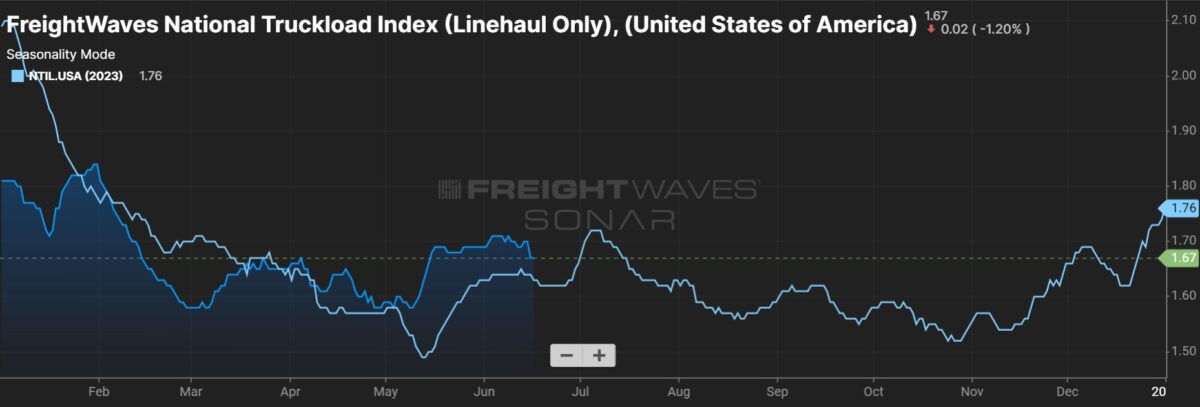
| TL Linehaul Index | -1.8% | -16.8% | -0.5% | NM |
Total freight expenditures captured by the dataset improved 0.8% seasonally adjusted from April and were 9% lower y/y. The y/y decline was improved from a 16.8% drop in April. The outlook for expenditures was unchanged — down 16% y/y in the first half and 10% for the full year.
The comparisons to the prior year get easier for both datasets as the biggest declines were logged in the second half of 2023.
With shipments down 3.1% and expenditures up 0.8% (both seasonally adjusted) the implication is that actual freight rates increased 3.9% sequentially in the month. That calculation can be volatile as it includes changes in fuel, modal mix and accessorial charges. Fuel prices were down more than 4% from April to May, presenting a headwind to the implied rate metric.
The y/y decline in implied rates was 10 percentage points lower than in April, “the narrowest decline in sixteen months.” Implied rates for full-year 2024 are expected to be 6% lower y/y.
The Truckload Linehaul Index, which excludes changes in fuel and accessorial charges, fell sequentially for the first time in four months, down 0.5% from April. The index was down just 1.8% y/y, but the report said it “seems unlikely to turn positive quickly.”
The linehaul index includes spot and contract freight.
“With spot rates steady over the past several months, downward pressure on the larger contract market is lessening, with few instances of contract rate increases bucking the downtrend recently,” the report said.
Similar commentary was shared by management from carrier Werner Enterprises (NASDAQ: WERN) at an investor conference last week. While rate pressure persists in the current bid season, Werner has been holding the line on pricing as it contends it has no margin left to surrender after years of above-normal cost inflation.

The report said excess truck capacity in the market is not solely due to “small carriers hanging on longer.” It said capacity growth among the private fleets is also weighing on the supply-demand dynamic.
“Excess earnings during the pandemic are certainly a factor, but to assign responsibility for ongoing overcapacity only to small fleets risks missing the larger private fleet capacity expansion which continues to defy our expectations,” the report said. “The for-hire cycle will improve once excess capacity additions end. That will likely be a while.”
Data used in the indexes is derived from freight bills paid by Cass (NASDAQ: CASS), a provider of payment management solutions. Cass processes $38 billion in freight payables annually on behalf of customers.


Matt Smith
I don’t believe Warner is telling the hole truth.
Theyve got way more loads than they can haul and are out sourcing to independent contractors for around $2 a mile. Every load I pulled for them was 3 to 4 days late when I picked it up.
Just my opinion but those big companies with ten times more trailers then they have trucks to pull em is one of the main reasons why the rates never go up. Between them and the brokers paying 1.85 to 2 a mile while everything else in the entire industry has almost doubled in the past 3 years. And they can’t figure out why there’s a supply chain problem