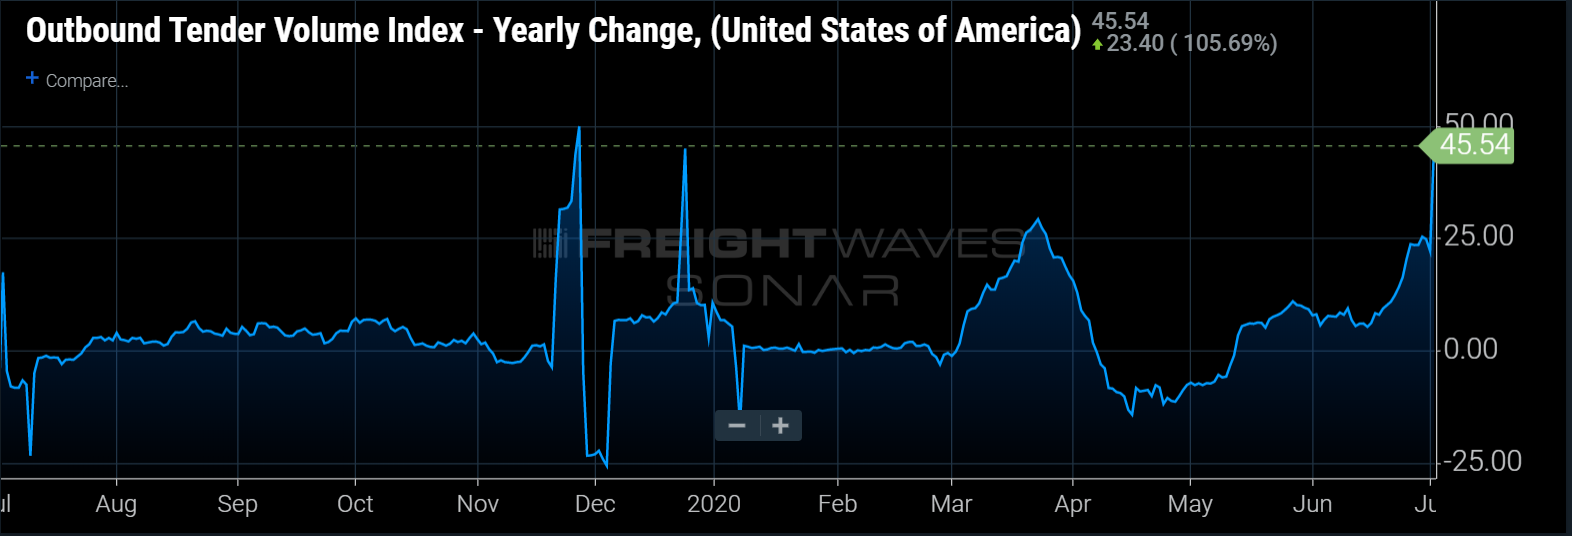
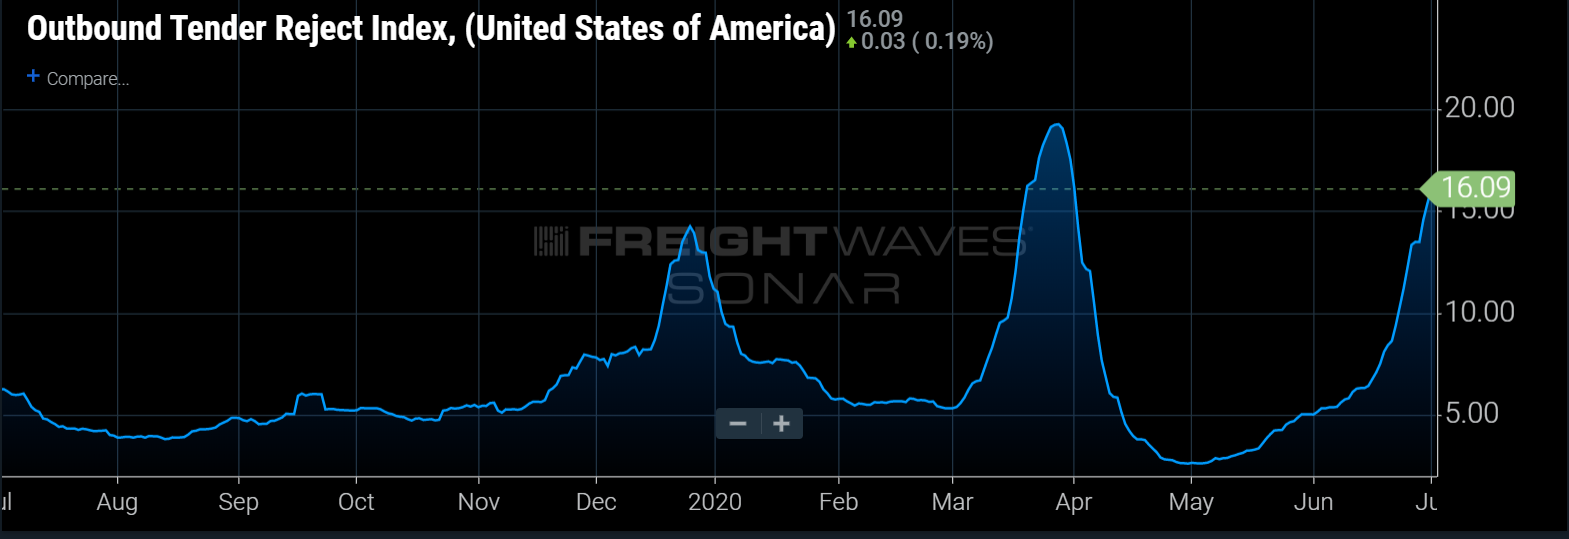
Volumes continued to burst all around the country last week. Carriers are rejecting loads at rates only seen during the March panic-buying spree buildup. Spot rates have been bid up above 2019 levels in many markets around the country, but it is unlikely that this trend continues given there is typically a significant drop-off in outbound volume after the Fourth. However, volumes are so high currently that even a significant decline could still keep OTVI above 2018/2019 comparables.
Outbound tender volumes continued to gush in many regions around the country this week. The Outbound Tender Volume Index (OTVI) is now almost at 13,000 for only the second time in its three-year history, with the first coming just three months ago during the March panic-induced buying spree.
The current volume of freight flowing in the U.S. cannot be overstated — besides the March demand spike, there has not been freight demand like this in recent history. 2018 was considered a banner year for freight volume and OTVI currently sits more than 14% above the 2018 high point.
There is typically a surge in volumes leading up to Independence Day as shippers try to clear as much inventory as possible before the close of the second quarter. After a lost April and depressed May, we believe shippers are particularly focused on pushing freight to paint the second quarter as rosy as possible. Independence Day often marks the beginning of the midsummer slowdown that drags on throughout July and August before picking up at the edge of autumn. If 2020 is to follow historical patterns, we should expect this extremely high volume level to last only a few more days. That said, 2020 has followed very few historical patterns, so there is a great deal of uncertainty about where demand will be in the third quarter.
It appears highly unlikely for volumes to continue in this range after the Fourth. In each of the past two years, OTVI has averaged roughly 10,200. A major retraction in tender volumes would need to take place for the index to average similar levels as the previous two years.

On the positive side, nine of the 15 of the major freight markets FreightWaves tracks were positive on a week-over-week basis. This ratio has been consistently high in recent weeks. The markets with the largest gains this week in OTVI.USA were Laredo, Texas (11.33%), Los Angeles (8.57%) and Dallas (6.93%). The markets with the largest declines this week in OTVI.USA were Cleveland (-10.68%), Memphis (-2.63%) and Indianapolis (-2.42%).


Tender rejections continue to soar with volumes, now at 16%
Carriers continued for a second week rejecting loads at a much higher rate this week that at any time since the panic-buying spree. The Outbound Tender Rejection Index (OTRI) jumped an additional 500 bps over the past week after running up more than 400 bps last week. The last two weeks have been among the more volatile weeks for OTRI in its three-year history.
We wrote during late May and early June that we believed capacity had been slow to adjust to the volume levels, but last week that changed. Volumes have remained elevated since Memorial Day, but carriers have been slow to reject freight. This was likely an attempt to make up for those “lost” months of April and May.

Much like volumes, tender rejections tend to trend higher in the week(s) leading up to a national holiday. However, this spike is unlike those of any leading up to a summer holiday in the past few years. This change in rejections may not only stem from holiday disruption, but also from carriers looking for other opportunities in this time of freight abundance. This level of tender rejections indicates upward pressure on rates and carriers have begun to test the waters.


