


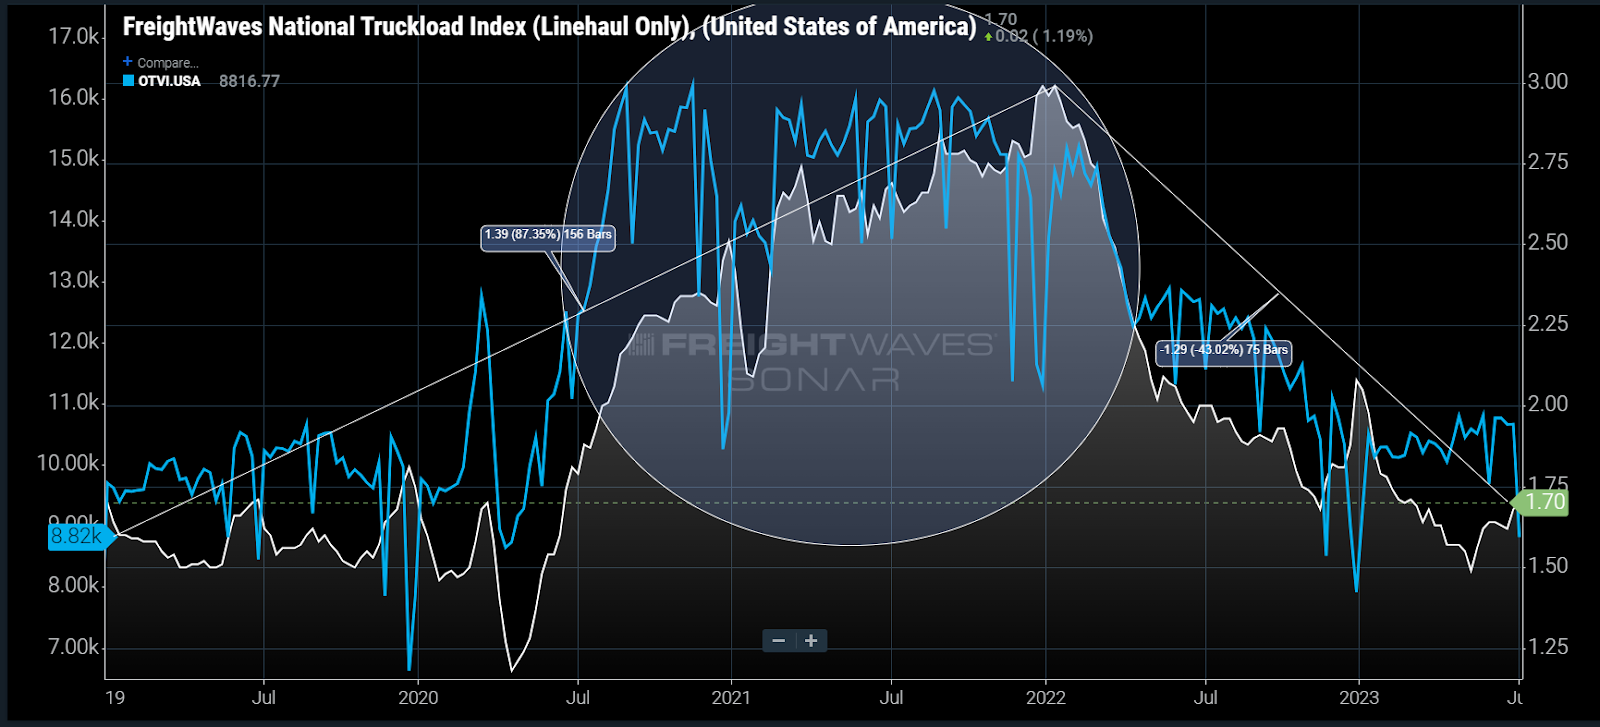
Chart of the Week: National Truckload Index Linehaul Only, Outbound Tender Volume Index – USA SONAR: NTIL.USA, OTVI.USA
Truckload spot rates excluding estimated fuel costs are up ~13% since early May with truckload tender volumes up 7% since the start of the year, though still a shadow of what they were in 2021. Is the freight market finally recovering from its post pandemic hangover or is this simply a seasonal bump of false hope?
The answer to both questions is yes. The fact there is any semblance of seasonal movement instead of a continuous downward trend is a sign that the freight market is stabilizing, but it is not definitive evidence that supply and demand have rebalanced.
Rates are noisy
Spot rates are a culmination of multiple factors. At their simplest they measure the fair market value for moving a truckload in a given lane. That value tends to increase around the holidays as shippers have narrowing service windows and carrier availability becomes increasingly limited.
At times, the simple fact that many people expect rates to become more expensive can inflate the market without capacity actually tightening meaningfully. This occurs due to the lack of transparency, where neither shippers, brokers nor carriers have a complete view of the market.
Carrier costs are also a component of the rate. While the direct costs like labor and equipment are easier to estimate from an outside perspective, the network component driven by their unique customer footprint makes them less understandable.
For instance, a carrier may have more freight moving out than into the Houston market thanks to a large customer. This leads it to offer rates that are lower than market average (or even direct costs) into the Houston area so it can win more business and cover its obligations.
Losing this account would change the way the carrier prices freight into Houston. This is currently happening on a larger scale in the U.S.
As demand patterns have shifted post-pandemic, carrier networks are also in flux. The epicenter of the freight boom was in Southern California. Carriers priced loads moving into this region more cheaply than others to help position their trucks.
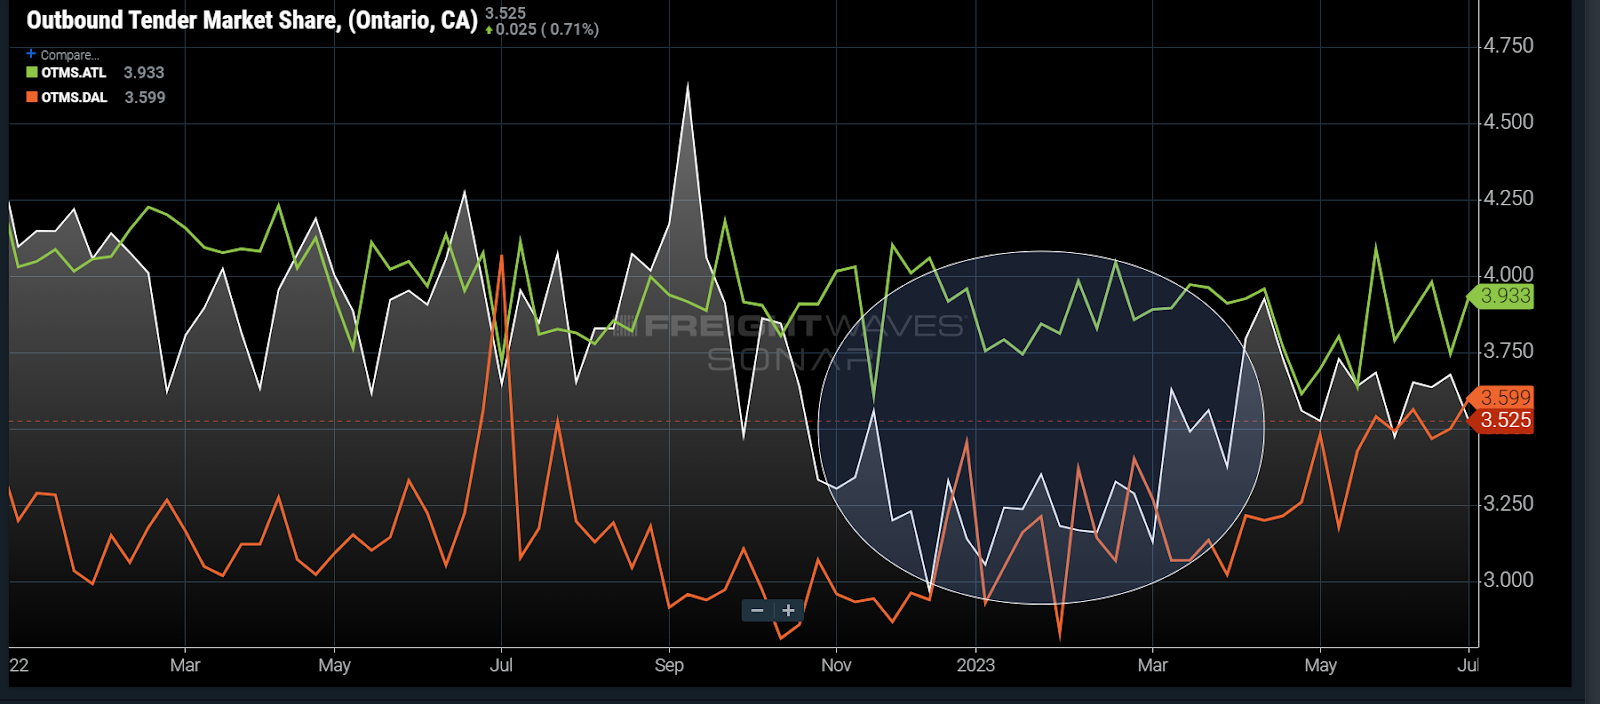
Ontario, California’s outbound market share fell from 4.25% at the beginning of 2022 to near 3% at the end of that year while Atlanta has remained relatively flat and Dallas has grown.
Demand has fallen more sharply out of Southern California than many of the larger Eastern markets, leaving freight contracts underpriced heading out West. Pair that with a relatively low amount of freight moving in that direction and you get less capacity in the region, exposing it to more price fluctuations.
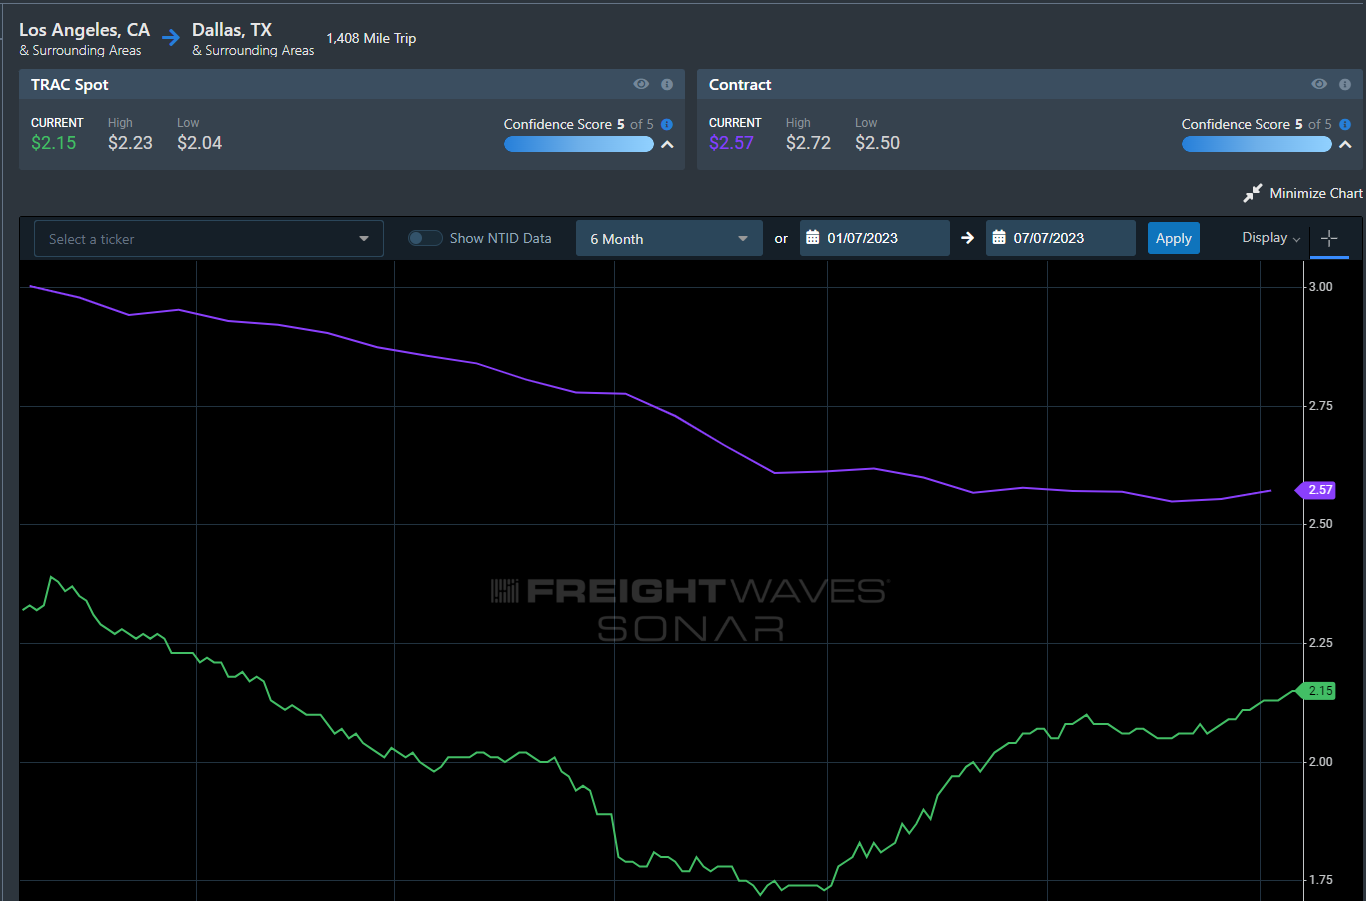
The current spot rate from Los Angeles to Dallas according to FreightWaves TRAC is $2.15 per mile — up 23% from May 1. The near-term increase is impressive, but rates are still well below contract and 20% lower than last year. There is a rebalancing act taking place that is pushing rates back into equilibrium.
Demand seems stable
The national Outbound Tender Volume Index (OTVI), a measure of shipper requests for truckload contract capacity, has been trending higher since January and is following a semblance of a seasonal pattern that existed prior to 2020.
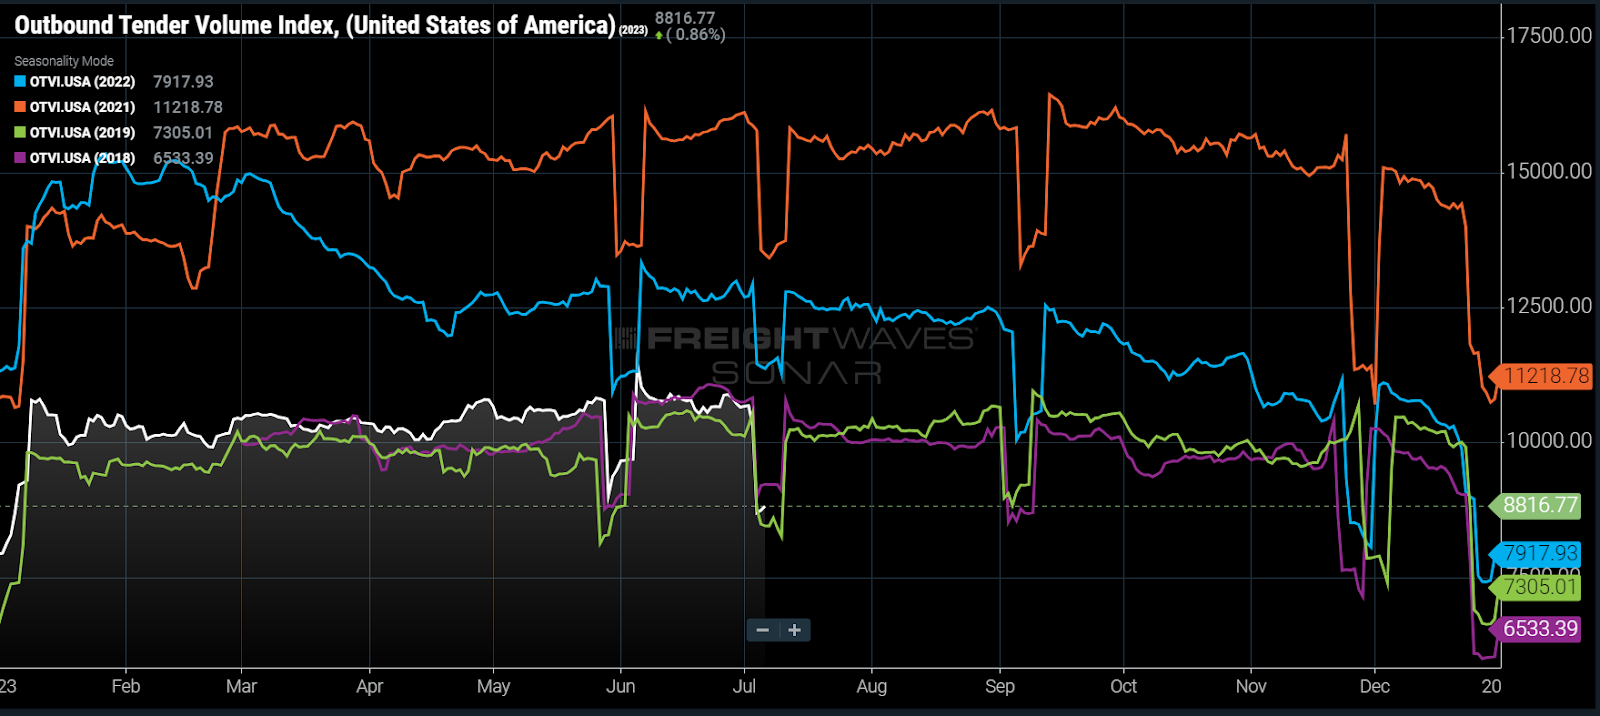
Comparing 2023 to pre-pandemic 2018 (purple) and 2019 (green), spring demand came and sustained earlier than usual. Another takeaway is that the market can expect demand to ease to an extent in July without cause for alarm.
The main takeaways as we close the first half of 2023 are that the market has found a demand floor and there is no strong evidence that spot rates will sustain their trend beyond the typical summer seasonality bump. The Western regions are tightening, but this will smooth out as pricing aligns. The majority of the bubble has burst but capacity is still due for a strong correction.
About the Chart of the Week
The FreightWaves Chart of the Week is a chart selection from SONAR that provides an interesting data point to describe the state of the freight markets. A chart is chosen from thousands of potential charts on SONAR to help participants visualize the freight market in real time. Each week a Market Expert will post a chart, along with commentary, live on the front page. After that, the Chart of the Week will be archived on FreightWaves.com for future reference.
SONAR aggregates data from hundreds of sources, presenting the data in charts and maps and providing commentary on what freight market experts want to know about the industry in real time.
The FreightWaves data science and product teams are releasing new datasets each week and enhancing the client experience.
To request a SONAR demo, click here.
Patrick Ryan Taylor
I wish I could post photos right now from the DAT LOADBOARD. It’s absolute insanity at its finest, and I can name personally 17 brokerage firms who underplay the owner operator by 300 to 400 a load. That’s sick, especially when they go home at night while the trucker sacrifices their very livelihood on the road day in and day out. Hey brokers, I own TaylorMade, yeah the big company, and I support truckers, not people who act like they work in an office. Maybe one day drivers will see these rates are unacceptable, and the simplest way to voice your voice, stop running the trucks. PT
Patrick Taylor
This is honestly the biggest joke ever. I have been in this industry for over 25 years and this is about the worst in freight rates it’s ever been. Make no mistake, these types of freight rates at a$1.00 to $1.50 or so a mile in sincerely a joke. I got paid this back in 1999. Truckers, get on your calculator, figure this stuff out. Between insurance, fuel, truck and trailer payments, reserves for breakdowns, etc YOU CANT SURVIVE!! It’s time for change, NOW, not when it’s convenient. Make the US Government do something about this. You haul product at least at a value a $100k or more right, but get get literally maybe 2 or 3 percent of the load? And are required to maintain your equipment at exhuberant costs? This is all bull honky and needs an immediate change!! I own a company and I’m literally pissed now for all of us!!!! PT
Stephen Webster
We need a min rate on reefer freight of $2 u s per mile plus $60/ hr at dock time plus drop pay a max of $4 us / mile plus tools and $90 / hr dock pay and dry van at 90 percent of those prices
Andrew Jackson
Meanwhile dry van rates from Northwest paying Under $1 per mile. Yeah I’m sure this bubble has “bust” facepalm.
Johnny Freight
Santos – Should the government get involved and “check on” carriers when the market flips and you guys are charging 10-11k for cross country runs and $4 per mile for local?
Jimmy
Hey Santos Exinia – Thanks for your comment to Zach. I just spoke to Zach, he told me to tell you that it is adorable that you think freight rates are determined by brokerages, and even more hilarious that you thing brokers make 50% margins on freight.
Santos exinia
The one who make the money is brokerage
That why trucker say the broker all 1/2 pie
Government got to get involved to check
The brokers ripping off the trucks
You have 13 experience .you say that every thing you trucks. This is for zach
.
Lawrence Scism
I think the spot rate at $2.15 a mile is a bit to low it should be locked in at $2.25 a mile due to fuel prices being higher between one state to the next.