Heartland Q2 earnings: Nowhere to go but up

Heartland Express recently released its Q2 earnings, which saw a net loss of $3.5 million. FreightWaves’ Todd Maiden writes, “This was Heartland’s fourth consecutive quarterly net loss when excluding one-time gains from the sale of real estate. It booked $25.6 million in gains from the sale of three terminals in the fourth quarter, which are viewed as nonrecurring benefits.”
Mike Gerdin, CEO of Heartland Express, wrote in the release, “Our consolidated operating results for the three and six months ended June 30, 2024, reflect the combination of an extended and significant period of weak freight demand, driven by excess capacity in the industry and ongoing operating cost inflation.”
Like bad fast food, Heartland’s purchase of Smith Transport and Contract Freighters Inc. (CFI) may still be causing indigestion. Viewing Heartland’s balance sheet, it appears the company used its cash to pay down the debt and financing associated with buying Smith and CFI. “Debt and financing lease obligations of $237.2 million remain at June 30, 2024, down from the initial $447.3 million borrowings less associated fees for the CFI acquisition in August 2022 and $46.8 million debt and finance lease obligations assumed from the Smith acquisition in May 2022,” said the release.
Paying off debt also leaves less money for capex. Heartland isn’t upgrading its fleet as quickly: Average tractor and trailer age crept up from 2.1 years on June 30, 2023, to 2.6 years as of June 30, 2024. Average trailer age rose from 6.1 years to 6.9 years during that same period.
For Heartland, there’s nowhere to go but up for its operating ratio, a common measure that truckload execs use to measure profitability. Maiden adds, “Heartland’s adjusted operating ratio (expenses as a percentage of revenue) was 99.4% in the quarter, 600 basis points worse y/y but well below the nearly 106% level the carrier operated at in the previous two quarters.”

Marten Transport Q2: Dedicated gets less dedicated

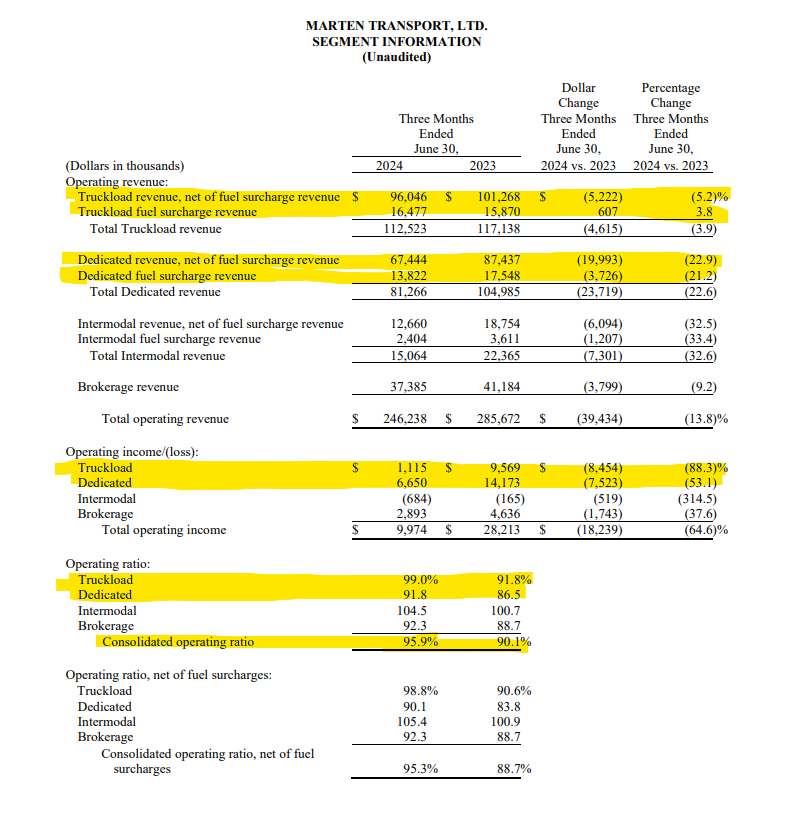
Marten Transport recently released its Q2 earnings, which saw a notable deterioration in both OR and its dedicated business. Management’s pushback on rate concessions and refusal to take rate cuts appear to have impacted its dedicated segment, which saw double-digit declines, more than its truckload segment, which saw low-single-digit declines.
Q2 dedicated revenue fell 22.9% compared to Q2 2023, from $87.4 million to $67.4 million, before a fuel surcharge was added. Compared to truckload, its OR remains favorable, falling only 53 basis points y/y from 86.5% in Q2 2023 to 91.8% in Q2 2024, not including a fuel surcharge. Adding a fuel surcharge saw a slight change from 83.8% to 90.1% during the same period.
Marten’s truckload segment, which management said was “heavily pressured by the freight market recession’s oversupply and weak demand,” fared worse. FreightWaves’ John Kingston writes, “And yet the truckload segment net of fuel surcharges produced an operating ratio of 98.8% compared to 90.6% in the second quarter of 2023. That’s because despite the fact that miles driven increased slightly, revenue net of fuel in truckload dropped to $96 million from $101.3 million a year ago. Average revenue per tractor per week net of fuel declined to $4,093 from $4,472 a year ago.”
There were some positives from the earnings release. Executive Chairman Randolph L. Marten said, “We are seeing increased interest by our customers to secure dedicated capacity and have recently added new multi-year dedicated programs for an additional 133 drivers starting in the third quarter.” Marten reiterated his previous statement that the company has not agreed to rate reductions since last August.
Market update: For-Hire Trucking Index moves closer to balance

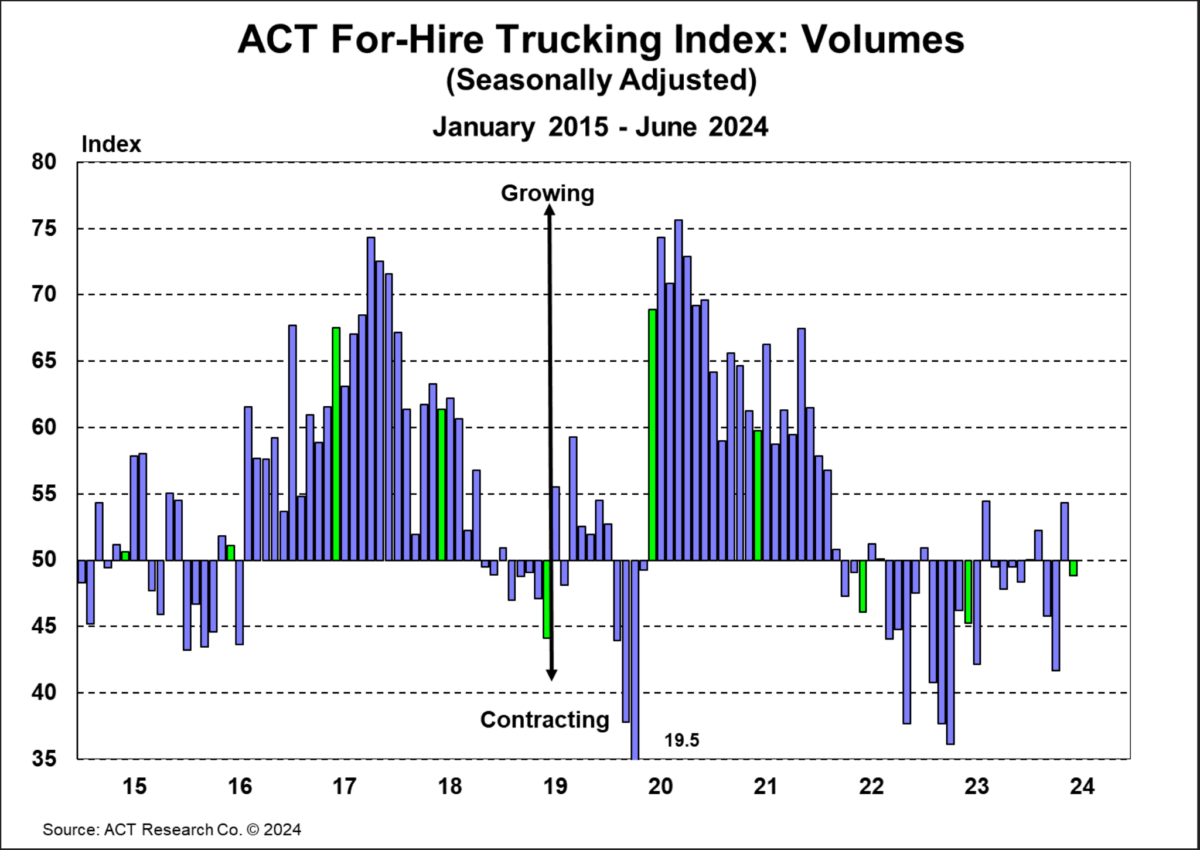
On Thursday, ACT Research released its July For-Hire Trucking Index data, which saw the balance between truckload supply and demand narrowing for June. Looking at the index, a value above 50 indicates expansion, while a value below 50 is a contraction. The volume index fell 5.5 points from May’s 54.4 points to 48.9 points in June. While volumes are not great, the report notes that it’s not as bad as June 2023’s reading of 42.8. Carter Vieth, research analyst at ACT Research, said in the release, “Even with consumers under strain, real US retail sales are up 1.8% ytd, and further disinflation helps support our outlook on real income growth. Additionally, intermodal and import volumes are trending positive, which minimally adds to overall surface freight volumes.”
Truckload capacity is nearing equilibrium, up 3.6 points from 45.6 in May to 49.3 in June. Vieth added, “Though the index increased m/m, this month’s For-Hire Supply Demand Balance June 2024 reading marks the 12th month in a row capacity has been below 50, the longest streak of decline since the inception of the survey in late 2009. Fleet capacity contractions occurring at a slower rate suggest the supply-demand balance between the fleet and freight is narrowing.”
Lower revenues and rates continue to impact fleet purchasing decisions, with 32.5% of respondents in June saying they plan to buy equipment in the next three months, below the historical average of 55.3%. The report notes that once rates improve, ACT expects an improvement in purchasing sentiment.
FreightWaves SONAR spotlight: Summer freight doldrums mute July Fourth rally

Summary: The rally in dry van spot market rates that led up to the Fourth of July holiday appears to have abated, according to recent data from the FreightWaves National Truckload Index, 7-Day Average. NTI continued its stairstep declines following the first week of July, falling 3 cents per mile all-in week over week from $2.35 on July 15 to $2.32. Month over month, spot rates are only 1 cent per mile higher than the $2.31 reported on June 23. The declines in spot market pricing power also extended into the contract space, which saw dry van outbound tender rejection rates fall 48 basis points w/w from 5.21% on July 15 to 4.73%.
The dry van segment was not the only equipment type to see declines following July Fourth. The flatbed and reefer segments fell as well. Reefer spot rates are down 3 cents per mile all-in w/w from $2.64 on July 15 to $2.61. Reefer outbound tender rejection rates dipped below 8%, falling 54 bps w/w from 8.5% to 7.96%.
The return of seasonality has been especially unkind to flatbed contract pricing power, with flatbed outbound tender rejection rates falling to low single digits, 4.91%, which is more similar to 2020’s reading of 5.47% than last year’s reading of 13.73%. A bright spot despite the contract rate declines was the slight uptick in flatbed spot market rates. FTI increased 3 cents per mile w/w from $2.72 to $2.75.
The Routing Guide: Links from around the web
Werner student driver wage lawsuit struck down for a third time (Land Line)
FMCSA says it has too little data to assess double-brokering fraud (FreightWaves)
Safety request for tougher rear guards not reasonable or practicable, NHTSA says (Trucking Dive)
Why do truck drivers leave a fleet? (Commercial Carrier Journal)
Legal challenges ahead for truck speed, hours-of-service rules? (FreightWaves)
Owner-operator concerns grow over labor classifications and hours of service (Fleet Owner)


