
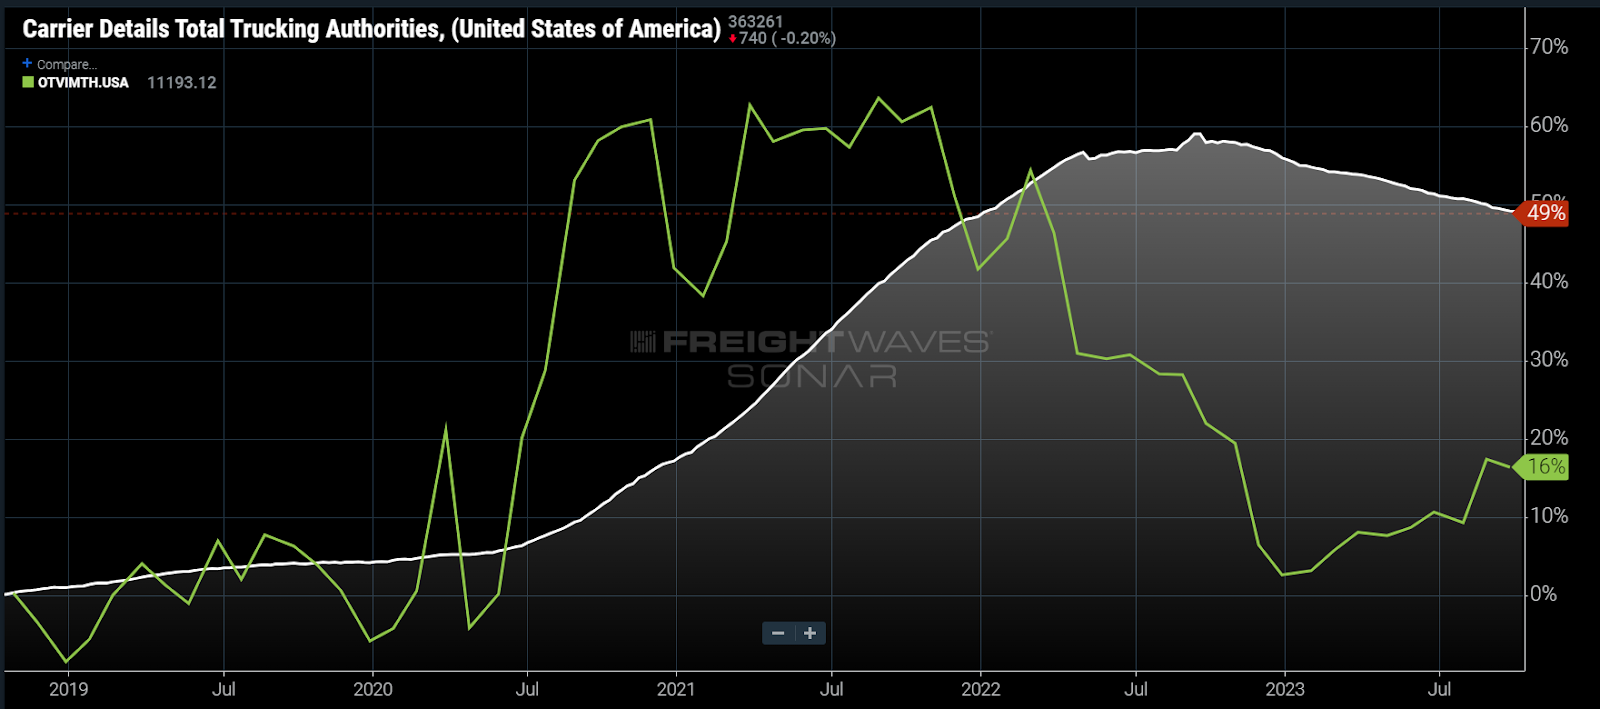
Chart of the Week: Carrier Details Total Trucking Authorities, Outbound Tender Volume Index Monthly – USA SONAR: CDTTA.USA, OTVIMTH.USA
Monthly truckload tender volumes for September were 16% higher than September of 2018. The number of carrier operating authorities reported by Carrier Details using FMCSA data has risen 49% over the same period.
The extraordinary excess of capacity is what is driving the current freight market conditions and as the chart suggests, capacity changes are very slow in relation to demand. Transportation service providers are forced into a waiting game of survival until it ends. While it may not seem like it, the tide is already turning.
Strangely, the pandemic was indirectly responsible for overstimulating the global economy. Government stimulus packages and increased time at home created the perfect storm of consumption of goods while travel and leisure services faltered.
In 2022, this trend reversed with violent force, a consummate example of an economic bubble manifesting in durable goods purchases. Not all have felt the shift equally, but the aggregate U.S. economy has certainly cooled since then.
None have felt that cooling more than transportation service providers, which have been dealing with challenging conditions since early 2022, when demand eroded rapidly. Some of the volume has recovered, but not nearly enough to support the existing capacity.
The latest example of the tough market conditions occurred last week as Convoy announced it was shutting down its brokerage division due to “a massive freight recession and a contraction in capital markets.”
FreightWaves CEO and founder Craig Fuller wrote an article earlier in the week about how brokerages were prolonging the capacity glut in this freight market downturn due to increasing presence in shipper routing guides and ability to connect smaller carriers to larger shippers.
As a byproduct of their rapid expansion and utility, they are now nearly as exposed to exiting the market as the asset-based fleets.
Too much of a good thing
There has been a lot of speculation about how long this downcycle will persist. I wrote a piece at the end of February of this year stating that there was at least 25% too much capacity based on my analysis of tender data.
Over time, the type of analysis I used becomes difficult to reapply due to a lack of visibility around supply-side dynamics. The above chart suggests that may have been an understatement.
Fuller wrote in his article mentioned above that the market has about a year and a half before capacity is more in alignment with demand, but he admits this is subject to economic changes and accelerations in carrier exits — the latter being very likely over the winter.
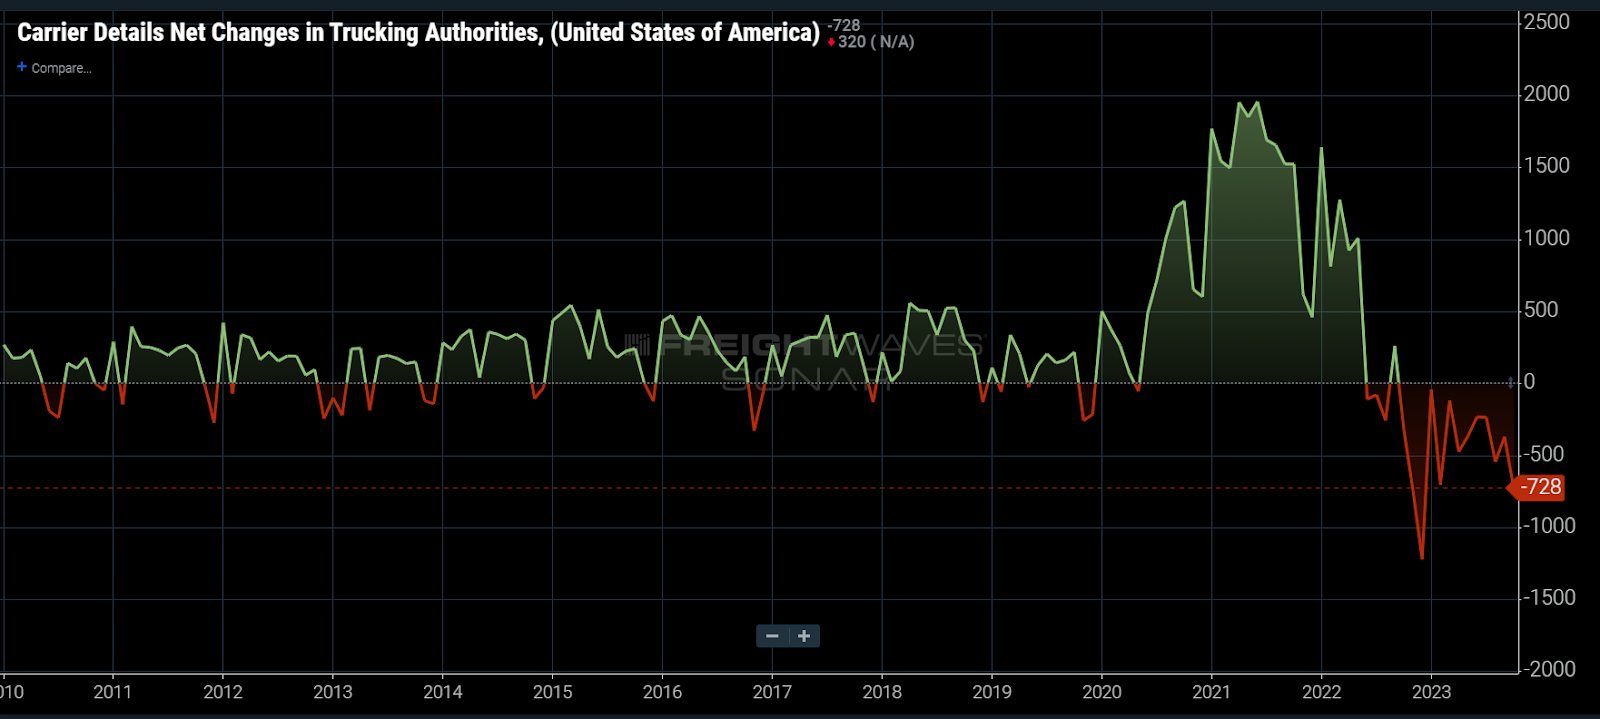
Looking at Carrier Details net changes in trucking authorities, which is based on FMCSA data, we have already seen a record rate of monthly exits that started in late 2022. The rate of exits has not come close to the rate of new authorities granted in 2021. Notice the rate of growth/exits hit low points near the turn of the year, an important trend to monitor.
While operating authorities are not a pure measure of capacity addition or subtraction, they are very good at explaining directionally where capacity is heading and at what rate. The problem with most estimations at this point is that they assume demand and supply side consistency and project it forward in a relatively linear manner.
Not a straight line
We are not in a stable pattern as the economy continues to show puzzling signs and the rate of carrier exits will most assuredly increase as the downturn persists.
The good and bad of all this is that it will not last. The market is already moving back toward equilibrium, though this is difficult to see. Spot and contract rates have traditionally been the manner to measure market conditions but have become convoluted with rapid cost inflation and sentimentality.
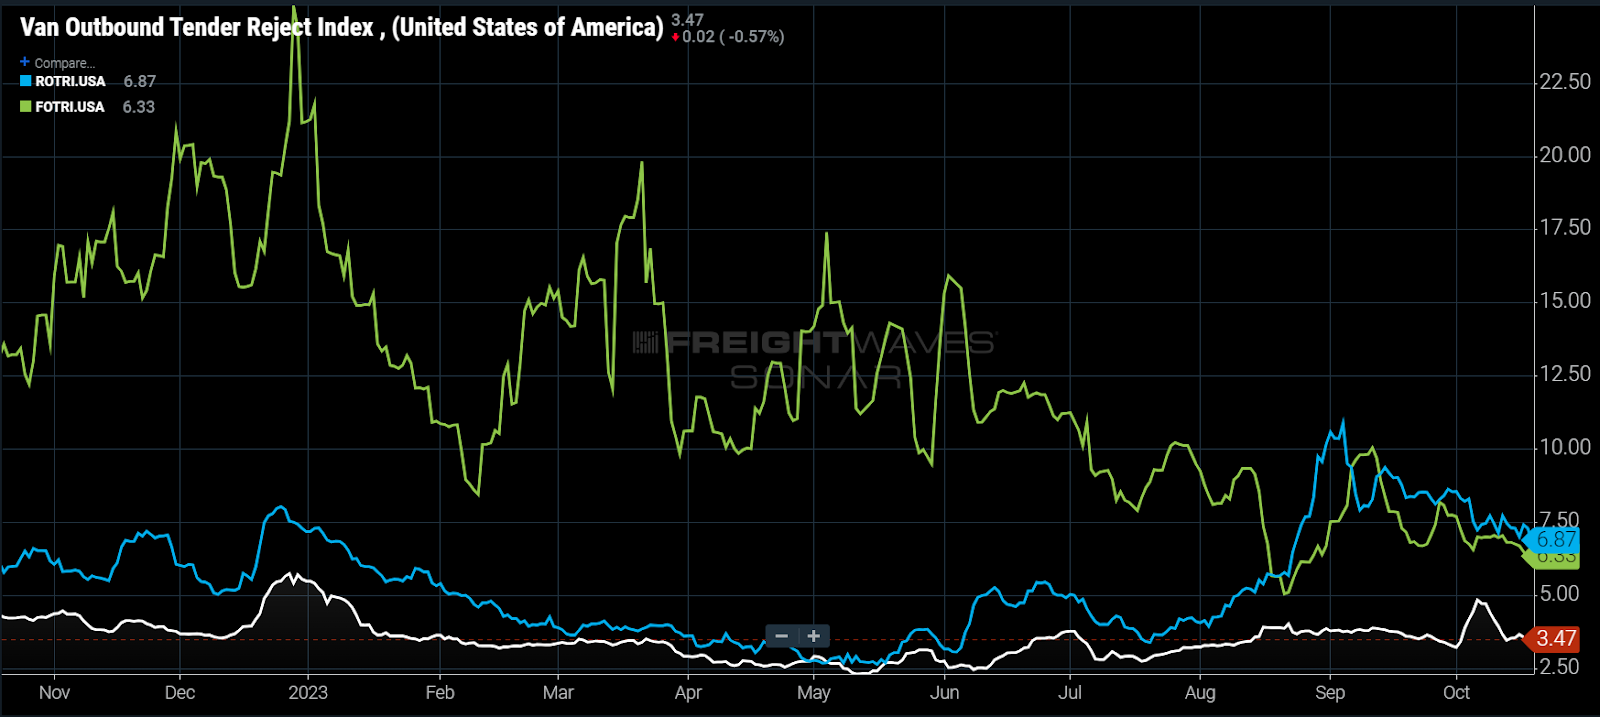
Tender rejection rates are far less noisy and probably paint the cleanest picture of the freight economy. Looking at rejection rates for dry van (white), refrigerated (blue) and flatbed (green) loads, the van market is still in a deep deflationary environment.
Flatbed has had a unique experience after supply chains unkinked in 2022 but has slowly moderated this year.
Refrigerated instability
Perhaps the most interesting is the refrigerated sector’s recent pop that occurred in August. While there is some seasonality involved here, it is worth noting that seasonal factors have not been as pronounced as the recent period.
The refrigerated sector could be the canary in the coal mine on the rest of trucking as it is showing increasing sensitivity to market conditions. Refrigerated rejections have been in close alignment with van over the past year, an anomalous occurrence, but are now showing increasing separation.
This too shall pass
This by no means says the market is about to shift dramatically, but it does tell us that capacity is eroding noticeably. At the bare minimum, it suggests a tighter peak season than 2022, but more importantly it insinuates that there is a chance that the market turns in 2024.
There is no definitive end to this market, but it is coming and it may happen faster than many expect. The current data seems to suggest that the market will not turn until 2025, but an acceleration in exits is inevitable. Gaps will open in route guides as providers drop before the correction is fully recognized.
This bust market is as unsustainable as the pandemic boom.
About the Chart of the Week
The FreightWaves Chart of the Week is a chart selection from SONAR that provides an interesting data point to describe the state of the freight markets. A chart is chosen from thousands of potential charts on SONAR to help participants visualize the freight market in real time. Each week a Market Expert will post a chart, along with commentary, live on the front page. After that, the Chart of the Week will be archived on FreightWaves.com for future reference.
SONAR aggregates data from hundreds of sources, presenting the data in charts and maps and providing commentary on what freight market experts want to know about the industry in real time.
The FreightWaves data science and product teams are releasing new datasets each week and enhancing the client experience.
To request a SONAR demo, click here.
CM Evans
I’m gonna ride this horse till it collapses or until someone provides some data to refute my point. Stop the Canada/Mexico trucks from conducting cabotage.
We know that the Carriers are skirting the Laws in some manner, and the brokers are likely doing the same.
Concerned Citizen
@Texas Trucker:
Your logic is not only flawed, it’s incomprehensible. The article is arguing that there is still too much capacity relative to the amount of freight demand. Nowhere is a “driver shortage” mentioned, and this site has repeatedly come under fire for arguing “driver shortages” are largely a myth. [Google “The perpetual truck driver shortage is not real” for a recent example.]
Obviously there’s a very large economic depression — the author says as much at the outset! But you can’t argue that “there’s a shortage of freight” and “not too many trucks on the road.” If supply (truckers) and demand (shippers) are imbalanced, then it’s as much an issue of oversupply as it is weakness in demand.
Your argument is like saying, in the dead of winter, “there’s a shortage of hungry kids with allowances, not too many ice cream trucks on the road.”
Stephen webster
I agree with Michael I see foreign students coming from India and Pakistan coming to Canada. They are being paid 42 cents cd or about 30 cents U S per mile to take loads to and from the U S local work is about $18 cd on payroll or $23 cd to a Corp account. A number of these trucks are controlled by a non-profit organization. They are currently bidding less than $2.40cd / mile or about $1.70us / mile
This is pushing many good trucking companies out of business in ont and the United States. The U S gov needs to stop all cross border trucking unless they agree to pay a hourly wage of at least $27U S / hr for all hours on payroll of any drivers that come into the U S and require all cross border loads to pay $2.30U S plus $100 / drop or pickup. Also no drivers from cuba or India or Pakistan until have been in Canada for a min of 3 years should be able to cross into the U S