


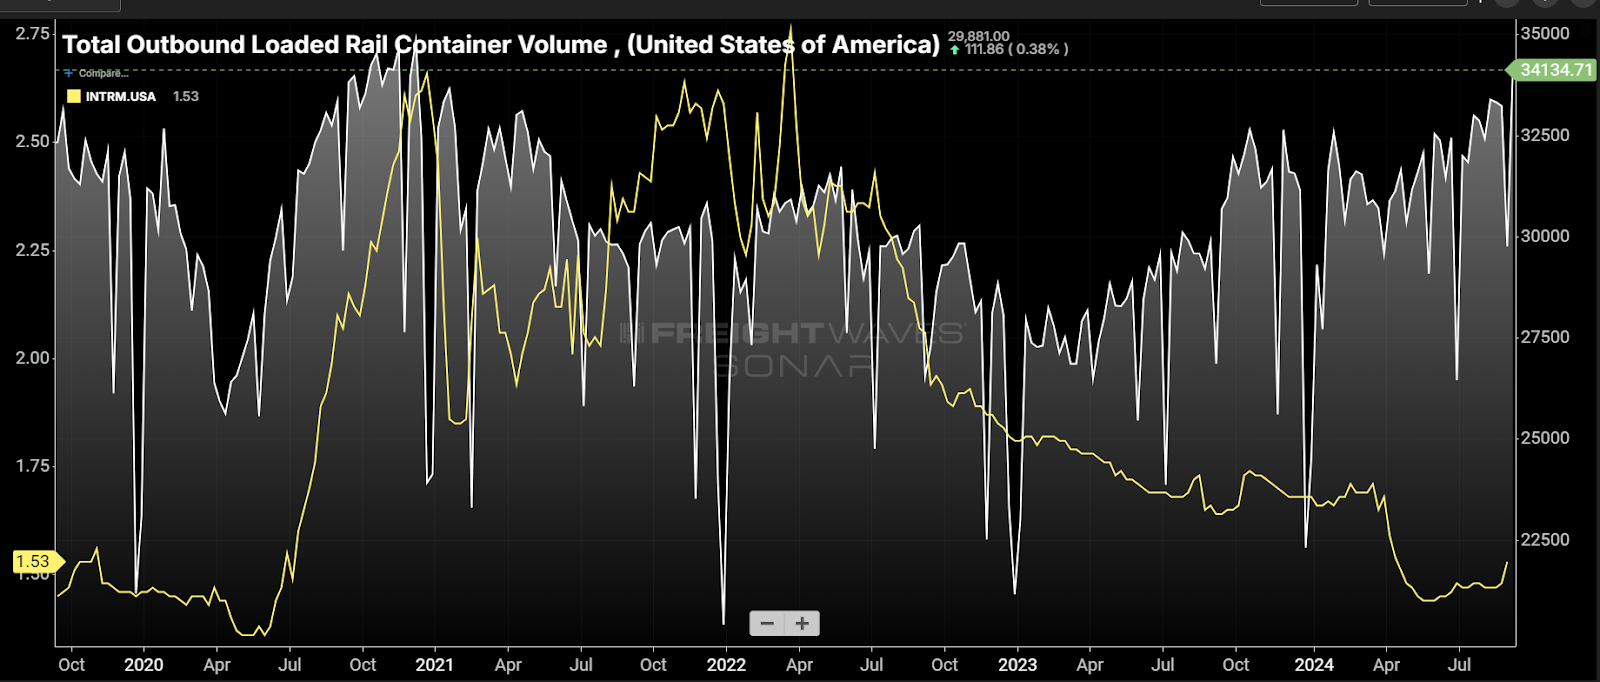
Chart of the Week: Total outbound loaded rail container volume, Intermodal spot rates – USA SONAR: ORAILL.USA, INTRM.USA
Intermodal demand is only 2% off the peak COVID-era value that it hit in late 2020, but spot rates are 42% lower than where they were at that point. Have the railroads solved all their problems?
Loaded intermodal — both domestic and international — container volumes are up 10% over 2023, but spot rates are down about 8%. This seems contradictory.
Demand typically correlates well with price changes in most commodities. That has not been the case in the domestic transportation market for a few years due to an oversupply of capacity.
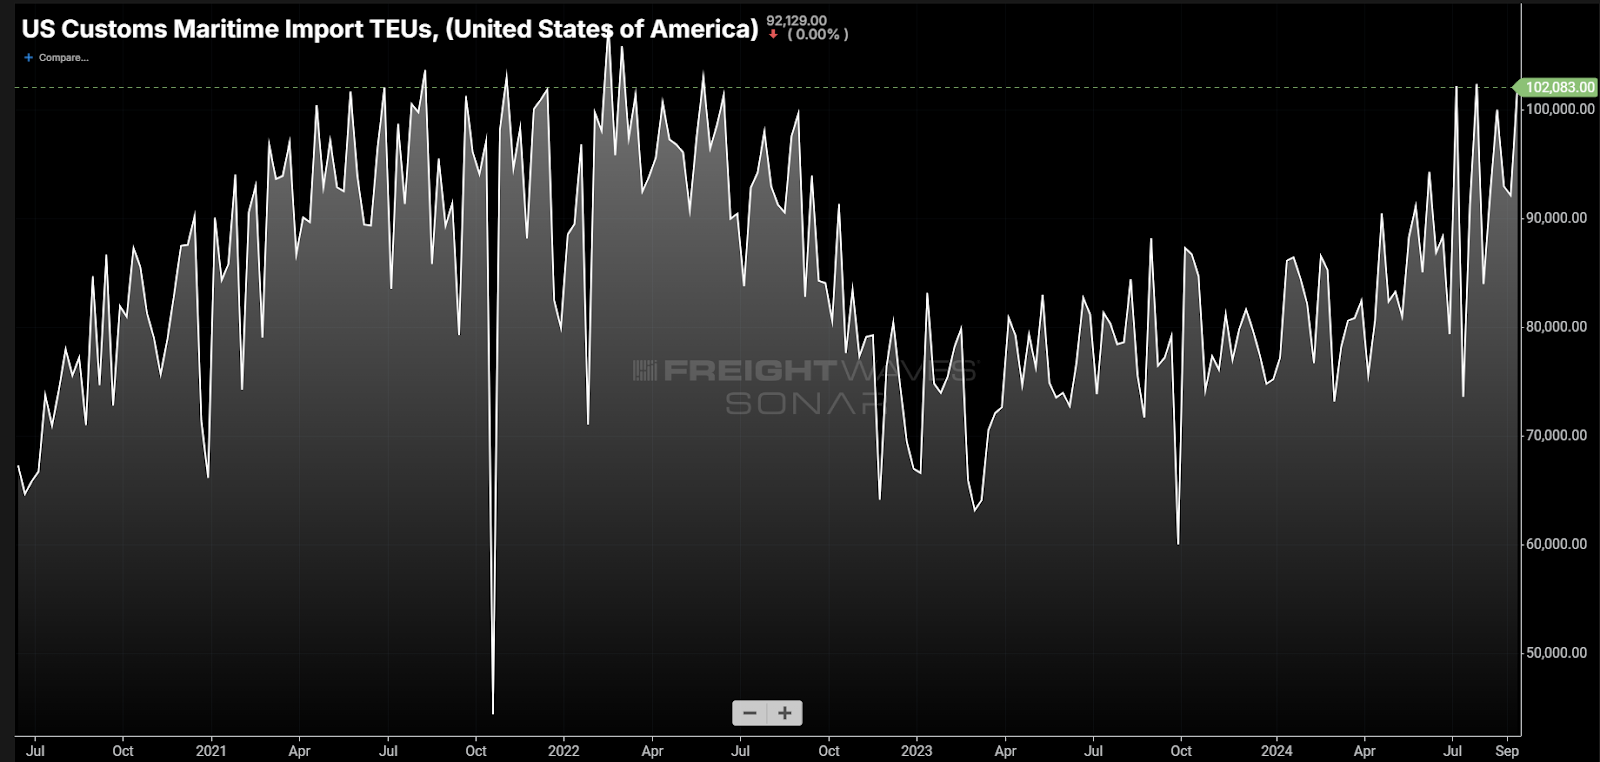
Container import growth surged this summer and is nearly on par with the pandemic-era levels heading into fall. This is the primary driver feeding domestic freight demand growth in the U.S.
During the pandemic years, the rails were heavily criticized for their lack of ability to handle the record volumes coming in from the ports. Infrastructure around the railheads and ports took the brunt of the blame.
To be fair, the volumes were unprecedented and no one could have seen that coming. The railroads have also been incentivized to operate as lean as possible to improve their operating margins for their investors — something that makes them less adaptive.
Loss of share
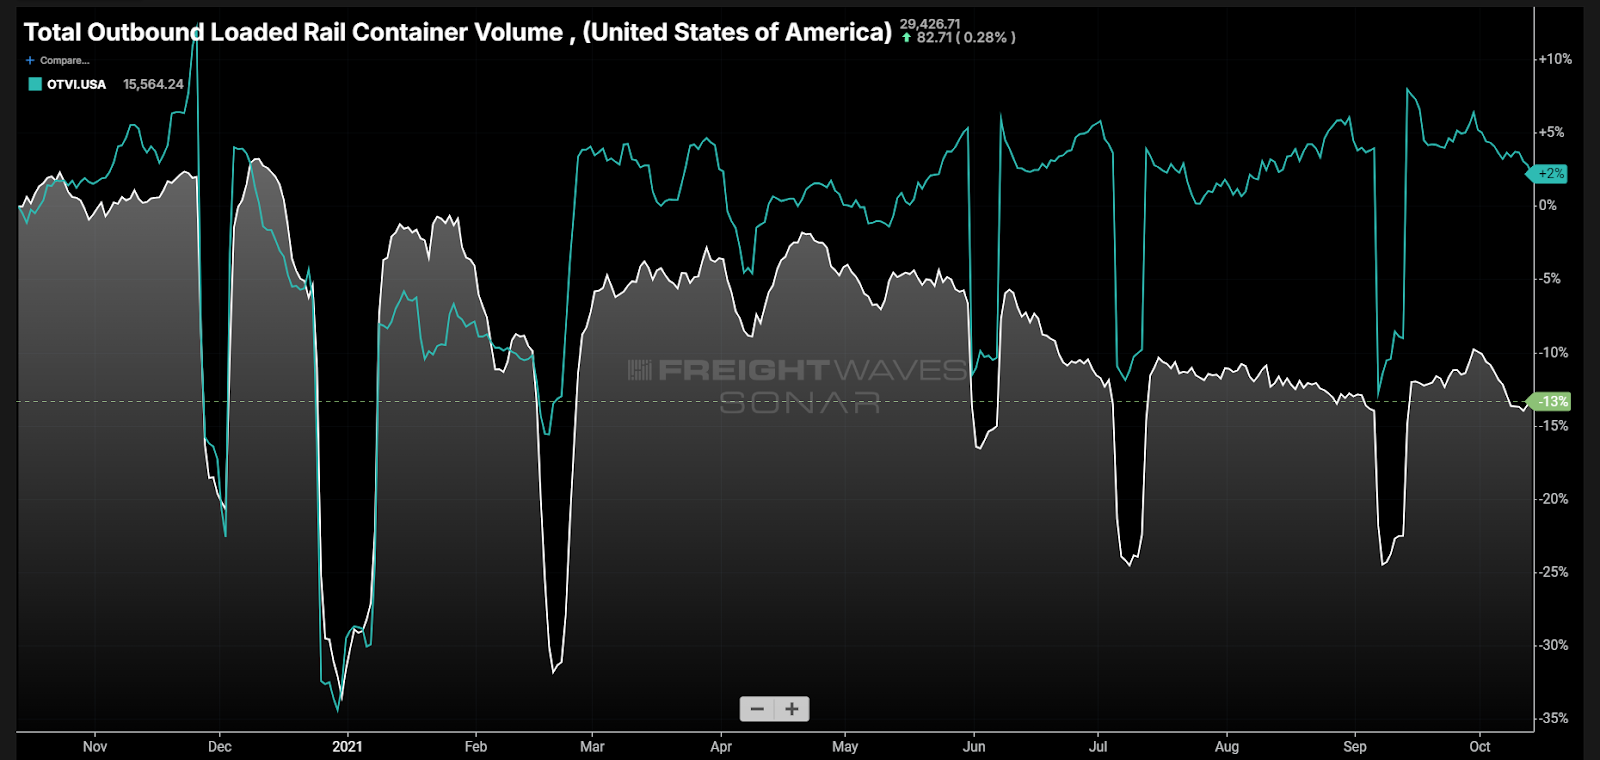
The combination of historic demand increase and limited infrastructure led to extreme service failures and incentivized shippers to push a lot of their freight to the truckload market. Intermodal demand fell 13% from October of 2020 to 2021, while truckload tender volumes grew about 2%.
To regain market share, the rails had to invest in better infrastructure and containers to be prepared for future opportunities. That appears to be paying off as a new wave of imports hits the port markets.
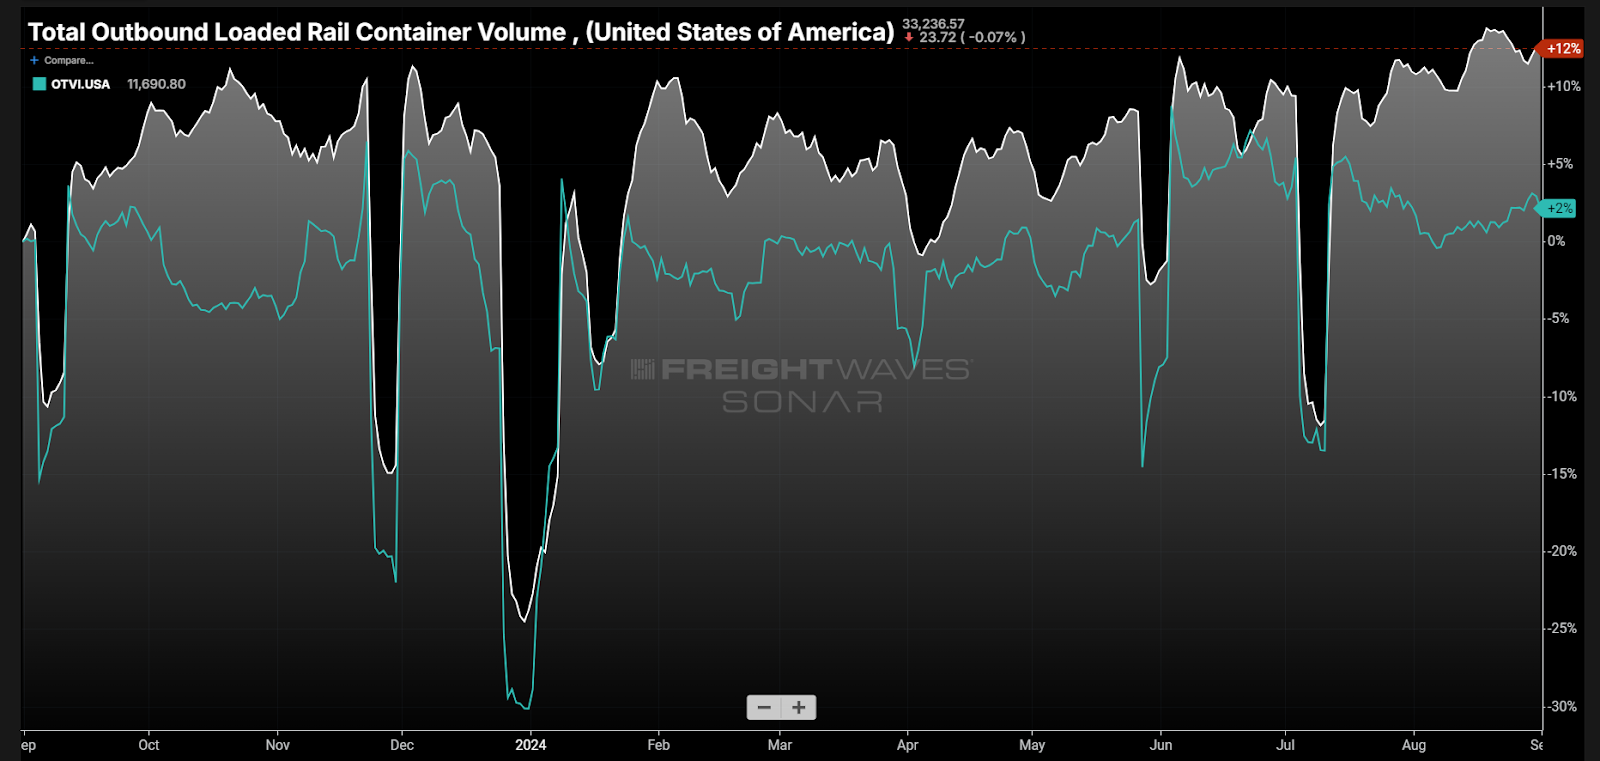
Loaded container volumes were up 13% y/y at the end of August, whereas truckload tenders were only up 2%. Loaded domestic containers were up 10% while smaller international sizes were up 16%.
Self-defeating?
The market share gains are positive for the railroads and intermodal providers in general but may not be as self-serving as it seems. They are hauling more volume but preventing disruption in the truckload market, keeping rates low.
The intermodal market is dependent on the truckload market—the sector it is helping keep soft by absorbing some of the most capacity-disrupting freight—for intermodal’s ability to raise prices.
Intermodal is mostly long-haul, with the largest lane in the U.S. being Los Angeles to Chicago. This takes a single truck driver close to four days to cover and at least that much to get back. With the dominant flow of freight being west to east, it is challenging to find enough freight to get back to California profitably.
For shippers, this is a near-term victory, but the end game remains marginally improved. The improvements to the railroad and port infrastructures are definitively long-term gains of efficiency and may help soften future market shifts, but the intermodal market share gain is only a short-term mechanism for keeping the market loose.
The longer the truckload market remains in a state of oversupply, the more capacity will continue to exit. This will leave truckload capacity more vulnerable to demand shocks in the future. This will in turn push all rates higher.
About the Chart of the Week
The FreightWaves Chart of the Week is a chart selection from SONAR that provides an interesting data point to describe the state of the freight markets. A chart is chosen from thousands of potential charts on SONAR to help participants visualize the freight market in real time. Each week a Market Expert will post a chart, along with commentary, live on the front page. After that, the Chart of the Week will be archived on FreightWaves.com for future reference.
SONAR aggregates data from hundreds of sources, presenting the data in charts and maps and providing commentary on what freight market experts want to know about the industry in real time.
The FreightWaves data science and product teams are releasing new datasets each week and enhancing the client experience.
To request a SONAR demo, click here.
Mike bauds
I’m sure baudenhaust has a made up article ready to go supporting intermodal