FreightWaves’ SONAR chart of the week (June 2, 2019 – June 8, 2019)
Chart of the Week: Inbound Tender Rejection Index (Los Angeles), Outbound Tender Rejection Index (USA) (SONAR: ITRI.LAX, OTRI.USA)
Roadcheck week has a measurable impact on driver behavior each year as many drivers shut down and take vacations or make repairs during the first week of June when this event occurs. International Roadcheck is a 72-hour period where members of the Commercial Vehicle Safety Alliance in Canada, Mexico, and the U.S. increase the number of inspections on commercial vehicles and target specific items to inspect. Last year it occurred on June 5-7 and had a noticeable impact on drivers avoiding some of the worst areas for getting stopped, like southern California where the second highest amount of out-of-service violations per highway mile occurs in the U.S. according to the FMCSA.
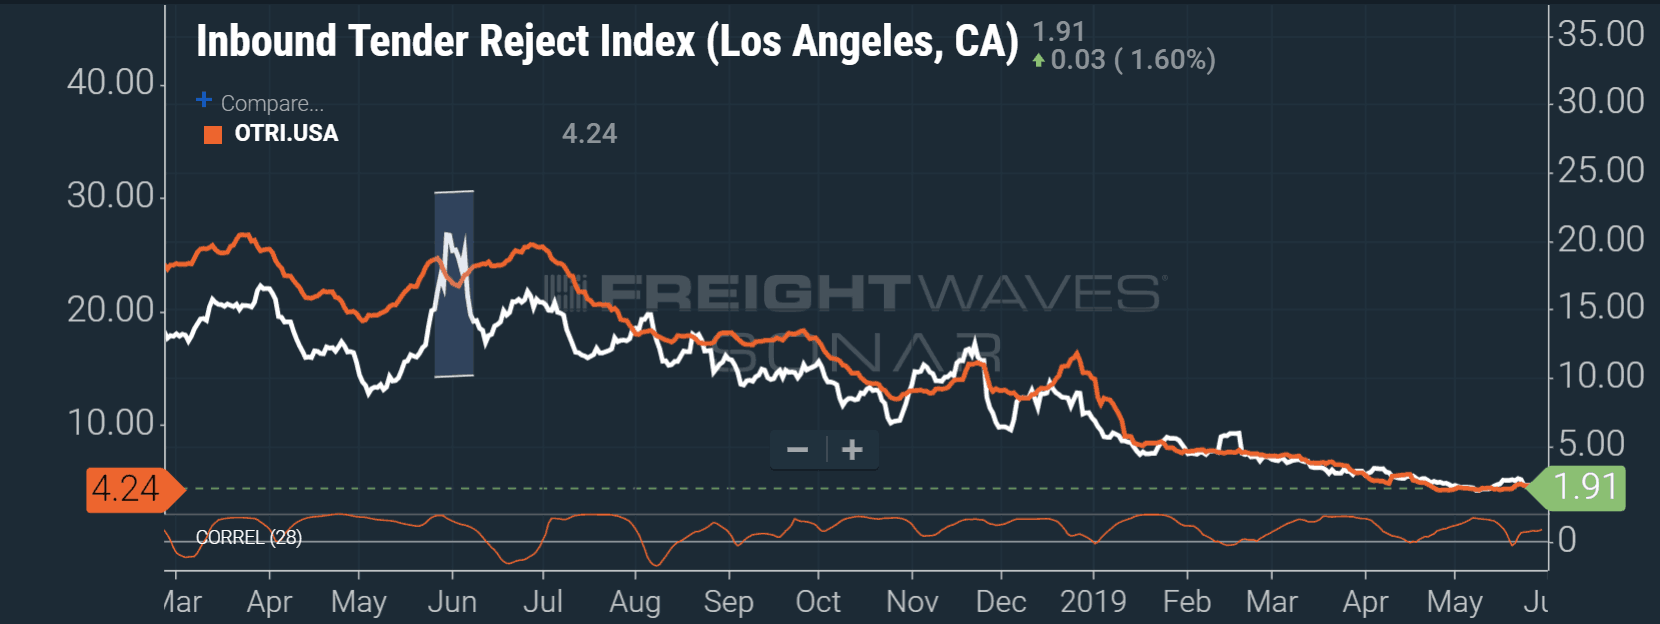
For truckers, heading into California can be challenging for many reasons notwithstanding the higher probability of getting ticketed for moving violations – Roadcheck Week is no exception. To highlight carriers’ reluctance to head to CA next week, our chart of the week is a combination of the inbound tender rejection index for the Los Angeles market (ITRI.LAX) and the outbound tender rejection index for the U.S.(OTRI.USA). The bottom line is measuring how correlated – using the coefficient of correlation – the two are over a 28-day period. The closer the correlation line is to the top the better the correlation.
The reason the relationship between these two numbers is important is the same reason financial investors compare the stock price movement of Google (GOOGL) to the S&P 500 Index (SPY). It is a benchmark for how the general market is moving, and that general market direction impacts all the stocks or, in this case, key freight market areas.
When a stock moves inversely from the rest of the market, investors will take note that there is something unusual happening with that stock that cannot be explained by the normal ebb and flow of investor behavior. The relationship between ITRI.LAX and OTRI.USA tells us there was something abnormal that occurred last year around this time. Carriers avoided the L.A. market as they were starting to accept more loads nationally.
There were only seven or so times over the past year where there was not some level of positive correlation, indicating the two measures move in the same direction roughly 95% of the time. As national rejections increase so do L.A. inbound rejections. Last year’s Roadcheck week was the largest break in pattern as carriers rejected loads more frequently than they did into the L.A. market all year, even more than the period when capacity was at its tightest nationally in late June. It was also the first Roadcheck after the ELD Mandate was implemented making carriers more nervous than usual.
Inbound rejection rates increased from 17.4% to 20.45% following Memorial Day and remained above 19% through June 5th while national rejection rates fell from 24.69% to 22.23% in the days following the holiday. Inbound rejection rates then plummeted below 13% by June 13th while national rates pulled back above 24%.

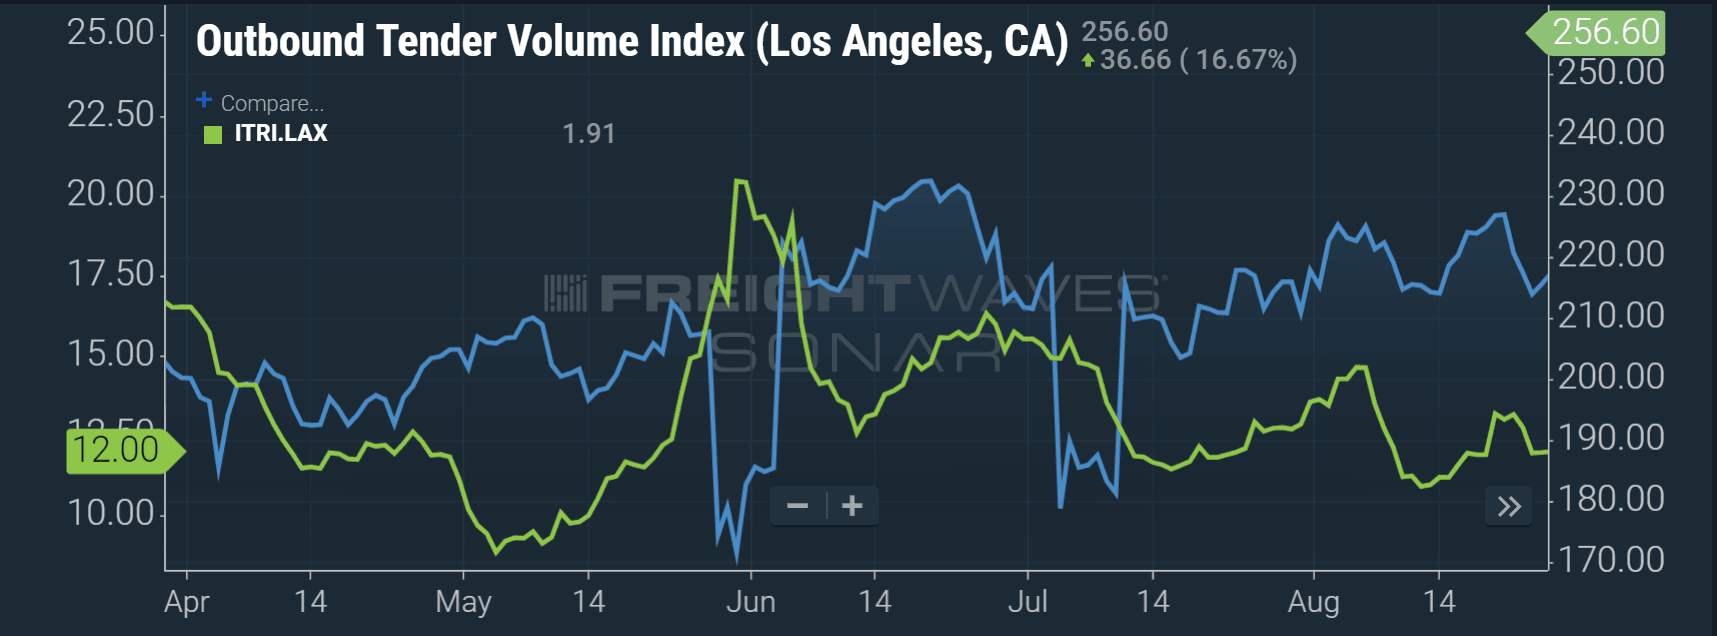
What was more astonishing is the fact outbound volumes were increasing during this time, meaning carriers would rather avoid inspection than haul freight. This same pattern has not developed this year as carriers’ attitudes have changed to one of more desperation versus abundance. Inbound rejection rates to L.A. are below 2%, showing little sign of significant increase heading into this week. National rejection rates were around an all-time low of 4.24% on Friday, a far cry from last year’s 24%.
This year’s Roadcheck is scheduled for June 4-6. It would seem carriers are more willing to get inspected in a softer market.
About Chart of the Week
The FreightWaves Chart of the Week is a chart selection from SONAR that provides an interesting data point to describe the state of the freight markets. A chart is chosen from thousands of potential charts on SONAR to help participants visualize the freight market in real-time. Each week the Sultan of SONAR will post a chart, along with commentary live on the front-page. After that, the Chart of the Week will be archived on FreightWaves.com for future reference.
SONAR aggregates data from hundreds of sources, presenting the data in charts and maps and providing commentary on what freight market experts want to know about the industry- in real time.
The FreightWaves data-science and product teams are releasing new data-sets each week and enhancing the client experience.
To find out more about SONAR go here or to setup a demo click here.


Jason
I personally dont know why the trucking industry has allowed this gouging by the government over a privately run industry to stay alive. Yoù as a trucking company can put an end to the ludicrous sanctioning that the government has imposed on us against our will.. i say strike till they retreat back to there lil scale shacks . The road side stops are unlawfull and do nothing but cost your drivers time money as well as companies lost miles.. i would however suggest semi yearly full inspections and well as alternating visual inspections by private parties. And these private parties be held to a greater quality control with loss of licence conditions for inadequate inspections…
The infringement of our freedom need to be addressed and soon
MaggieMay
Well written with a perspective I never considered.