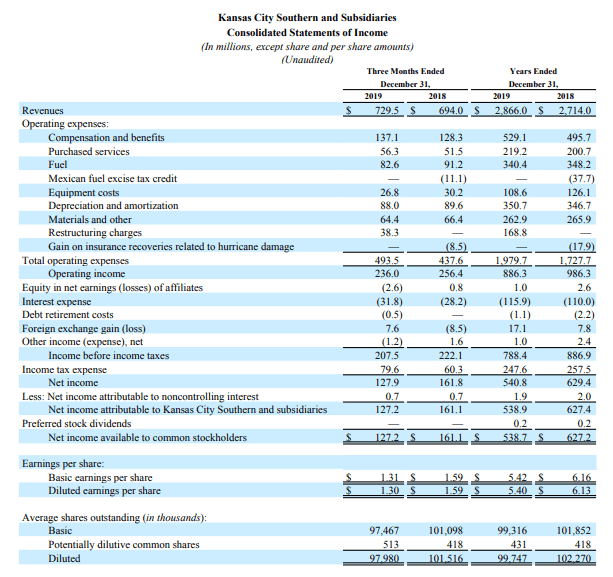
Net profit for Kansas City Southern (NYSE: KSU) slipped in the fourth quarter of 2019 compared to the prior year, but revenues were 5% higher amid increases for chemicals and petroleum and industrial and consumer products.
Fourth-quarter net income was $127.2 million, or $1.30 diluted earnings per share, compared with $161.1 million, or $1.59 diluted earnings per share, in the fourth quarter of 2018, the company said Friday.

Revenue in the fourth quarter totaled $729.5 million amid a 13% increase in chemicals and petroleum and an 11% increase in industrial and consumer products compared with the fourth quarter of 2018, Kansas City Southern (KCS) said. Automotive and intermodal volumes dragged overall carload volumes down by 1% in the fourth quarter.
Operating expenses were also higher, due in part to $38.3 million in costs because of restructuring charges related to KCS’ implementation of precision scheduled railroading in 2019. Fourth-quarter operating expenses were $493.5 million, compared with $437.6 million in the fourth quarter of 2018.
Operating income in the fourth quarter was $236 million, compared with $256.4 million in the prior year. Operating ratio was 67.6%, compared with 63.1% in the fourth quarter of 2018. KCS calculates operating ratio — a measure of a company’s financial health — by dividing operating expenses by revenue.

KCS is targeting an operating ratio of between 60% and 61% in 2020 and below 60% in 2021. Capital expenditures are expected to be around 17% of revenue through 2022.
Operating ratio in 2019 was 69.1%, although adjusted operating ratio was 63.2%. The adjusted figure divides adjusted operating expenses by revenue.
Service metrics improved in the fourth quarter, with average train speed of 15.2 miles per hour, compared with 11.2 mph in the fourth quarter of 2018, and average terminal dwell at 19.9 hours, versus 26 hours in the prior-year period. Terminal dwell is how long a train sits at a terminal.

| Rail | 2019 Value | 2018 Value | Y/Y Gross Change | Y/Y % Change |
| Freight revenue (in millions) | $729.5 | $694.0 | $35.5 | 5.1% |
| Carloads (000s) | 65 | 63 | 1 | 1.7% |
| Revenue per carload | $972 | $1,030 | -$58 | -5.6% |
| Intermodal shipments | 254 | 268 | -14 | -5.3% |
| Intermodal revenue per carload | $383 | $366 | $17 | 4.6% |
| Gross ton miles (in millions) | 25,745.0 | 25,031.0 | 714 | 2.9% |
| Train velocity (mph) | 15.2 | 11.2 | 4 | 35.7% |
| Dwell time (hours) | 19.9 | 26 | -6 | -23.5% |
| OR% | 67.6% | 63.1% | 4.5% | 7.1% |
| Diluted EPS | $1.30 | $1.59 | -$0.29 | -18.2% |


