This week’s FreightWaves Supply Chain Pricing Power Index: 35 (Shippers)
Last week’s FreightWaves Supply Chain Pricing Power Index: 35 (Shippers)
Three-month FreightWaves Supply Chain Pricing Power Index Outlook: 40 (Shippers)
The FreightWaves Supply Chain Pricing Power Index uses the analytics and data in FreightWaves SONAR to analyze the market and estimate the negotiating power for rates between shippers and carriers.
This week’s Pricing Power Index is based on the following indicators:
Volumes find positive momentum in August
The freight market was able to sustain year-over-year gains throughout August and saw the gap widen into the Labor Day holiday. As September is now here and the close of the third quarter is on the horizon, the question now becomes: When do the import levels that have been setting records at the Port of New York/New Jersey and at the Southern California ports flow into the truckload market. At the moment, the railroads have been able to take advantage of the higher imports, but eventually that will change as freight becomes more time-sensitive closer to the retail peak season.
To learn more about FreightWaves SONAR, click here.
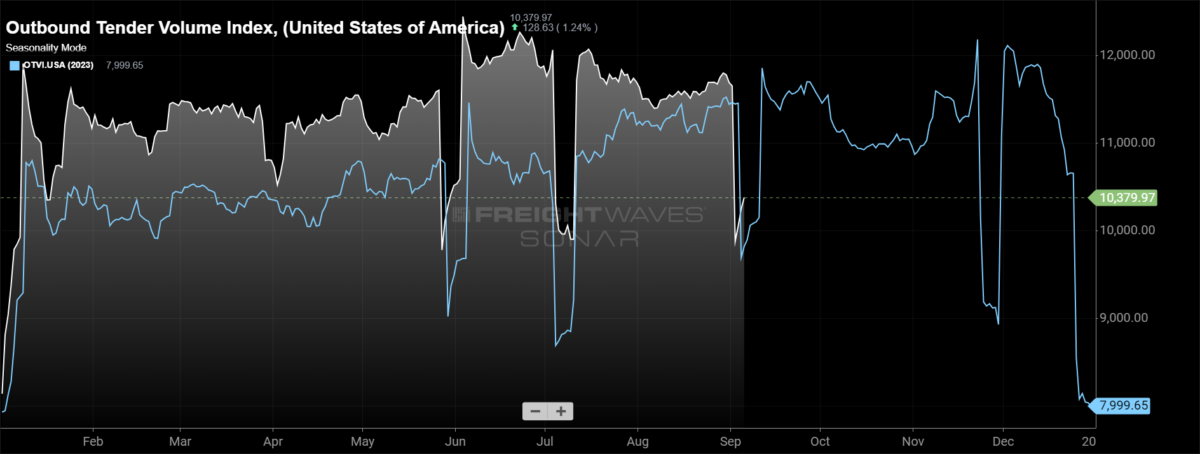
The Outbound Tender Volume Index (OTVI), a measure of national freight demand that tracks shippers’ requests for trucking capacity, is down 12.8% week over week, but the reason for that is the Labor Day holiday. The OTVI is a seven-day moving average, and holidays create nuances in the data. Next week, comparing on a two-week stack will provide better insight into how overall freight volumes are moving in September. The OTVI is still 3.57% higher than it was this time last year, which is slightly higher than it was throughout most of August.
To learn more about FreightWaves SONAR, click here.
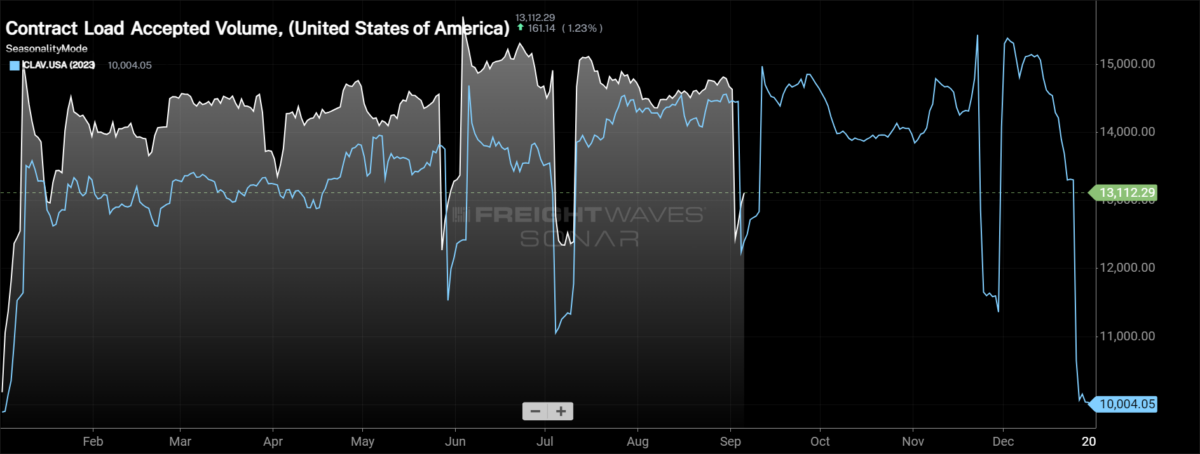
Contract Load Accepted Volume (CLAV) is an index that measures accepted load volumes moving under contracted agreements. In short, it is similar to OTVI but without the rejected tenders. Looking at accepted tender volumes, we see a decrease of 12.31% w/w, again affected by the Labor Day holiday, but the decline isn’t as severe as OTVI because tender rejection rates are lower week over week. Accepted tender volumes are up 3.58% y/y.
Bank of America’s most recent card spending report, for the week ending Aug. 31, showed some nice growth to close out the month. Total card spending, according to BofA, was up 2.8% year over year, but the report highlighted that the Labor Day holiday’s arrival two days earlier this year than last is likely the cause of the increase. Transit and lodging both saw growth during the most recent week, whereas gas spending was lower, likely a result of prices being lower y/y.
Online retail continues to shine through. It was 4.7% higher y/y for the week ending Aug. 31. Furniture spending also turned positive for the first time in quite some time, rising 2.7% after being down double digits for most of July and August.
To learn more about FreightWaves SONAR, click here.
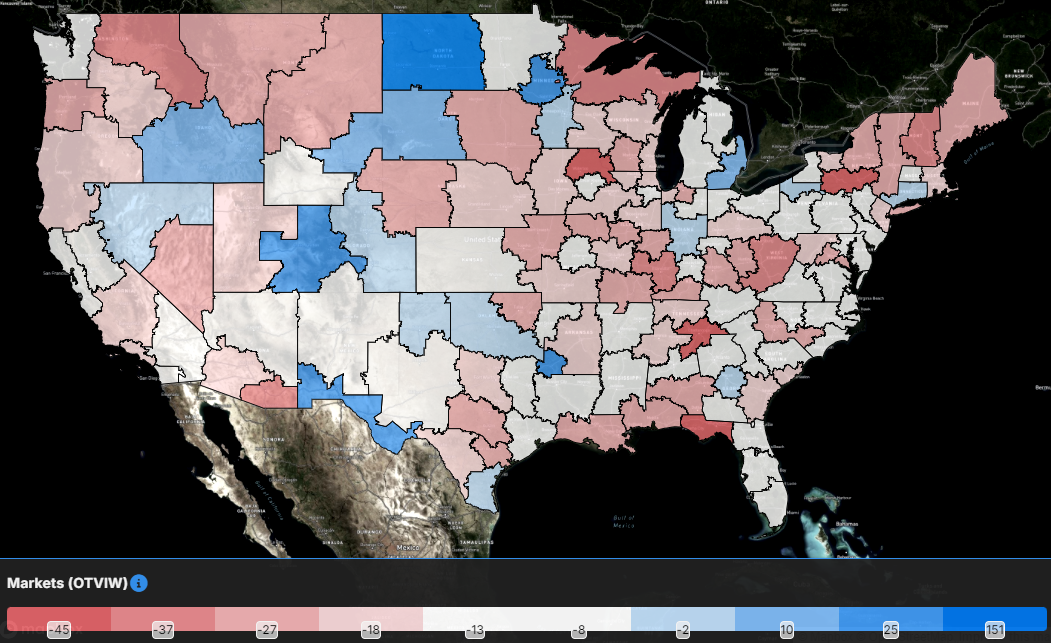
With the Labor Day holiday impacts weighing on volumes, weekly changes really don’t have a significant meaning to the overall market. That’s evident as 120 of the 135 markets tracked within FreightWaves SONAR experienced lower volumes week over week.
The impacts to volumes in Detroit happened ahead of the holiday, making it the only relatively large market that experienced volume growth over the past week. Volumes in Detroit are up 10.94% w/w, but that has more to do with the timing of holiday volume impacts than true volume growth. Why is that the case? Volumes out of Detroit are 2.23% lower on a two-week stack.
The rest of the increases in volume over the past week stemmed from extremely small markets overall, thus having little impact on the overall market.
To learn more about FreightWaves SONAR, click here.
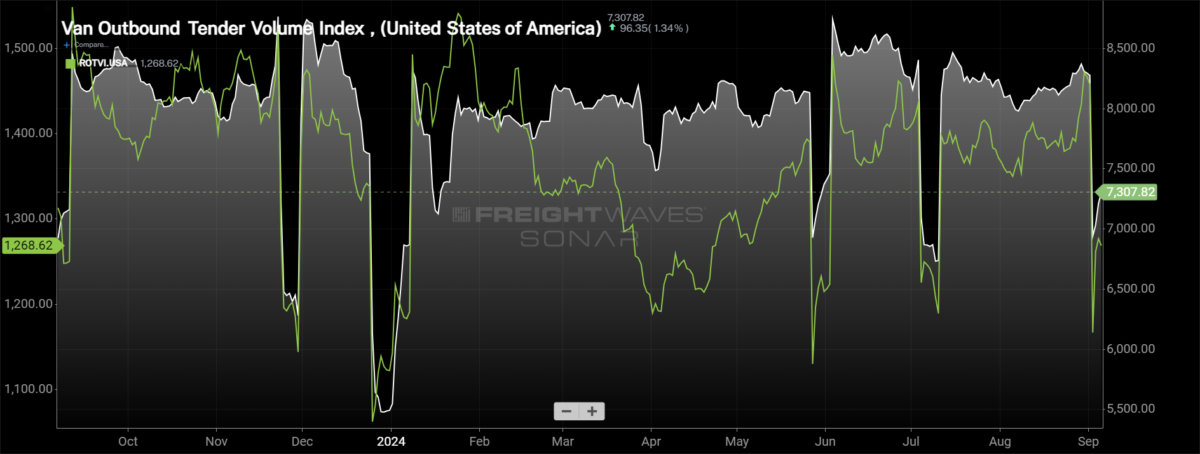
By mode: The dry van market was able to shake off the sluggish start to August and close out the month strong. The Van Outbound Tender Volume Index rose 1.5% throughout August. The comps w/w are challenged because of the holiday, down 12.69%, but y/y they are up 3.32%.
The reefer market saw a nice boost to activity to close out August. The Reefer Outbound Tender Volume Index rose 7.3% during August as the reefer market has continued to recover following a significant slowdown in March and April. Despite the increase through August, reefer volumes are currently down 2.63% y/y.
Rejection rates suffer largest weekly decline since mid-July
The reaction to the Labor Day holiday was muted from a capacity perspective, dashing the hopes of those looking for a boost. If there was a positive reaction, it would have signaled that slack had been removed from the market, setting up for tighter capacity in the fourth quarter. The lack of reaction shows there is plenty of capacity to continue to handle current demand levels, but there is still a chance that tender rejection rates will increase in the fourth quarter.
To learn more about FreightWaves SONAR, click here.
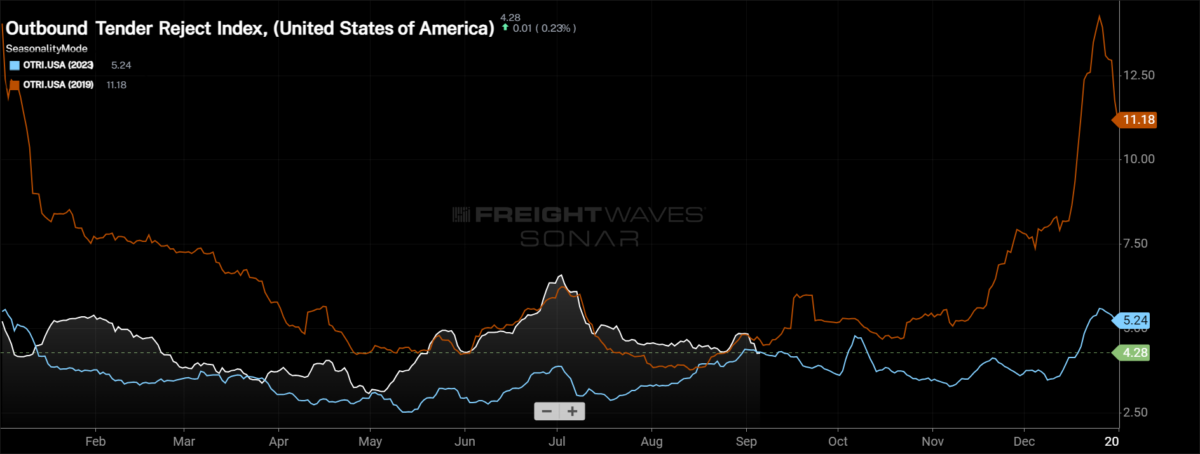
Over the past week, the Outbound Tender Reject Index (OTRI), a measure of relative capacity, fell by 58 basis points to 4.28%, the lowest level since May 19. The OTRI fell below both last year and 2019 levels coming out of the Labor Day holiday, which gives some cause for concern. At present, the OTRI is 3 basis points lower y/y and 38 bps below 2019 levels.
To learn more about FreightWaves SONAR, click here.
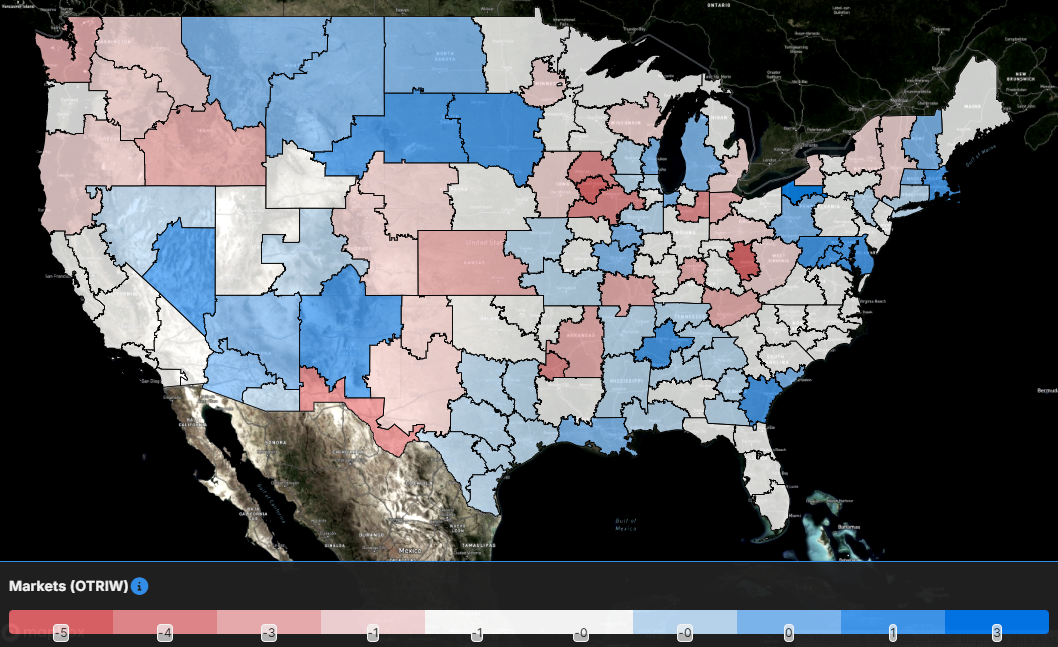
The map above shows the Outbound Tender Reject Index — Weekly Change for the 135 markets across the country. Markets shaded in blue are those where tender rejection rates have increased over the past week, whereas those in red have seen rejection rates decline. The bolder the color, the more significant the change.
Of the 135 markets, 49 reported higher rejection rates over the past week, a decrease from 76 in last week’s report.
The largest increases in rejection rates stemmed from the smaller markets overall, but Savannah, Georgia, did see an increase in rejection rates of 130 bps w/w.
In the largest market in the country, Ontario, California, rejection rates fell by 119 bps week over week to 4.26% as capacity has returned to the West Coast to try to capture some of the volume flowing through the ports of Los Angeles and Long Beach. With the decline, rejection rates in the major Southern California market are now the lowest they have been since May 9.
To learn more about FreightWaves SONAR, click here.
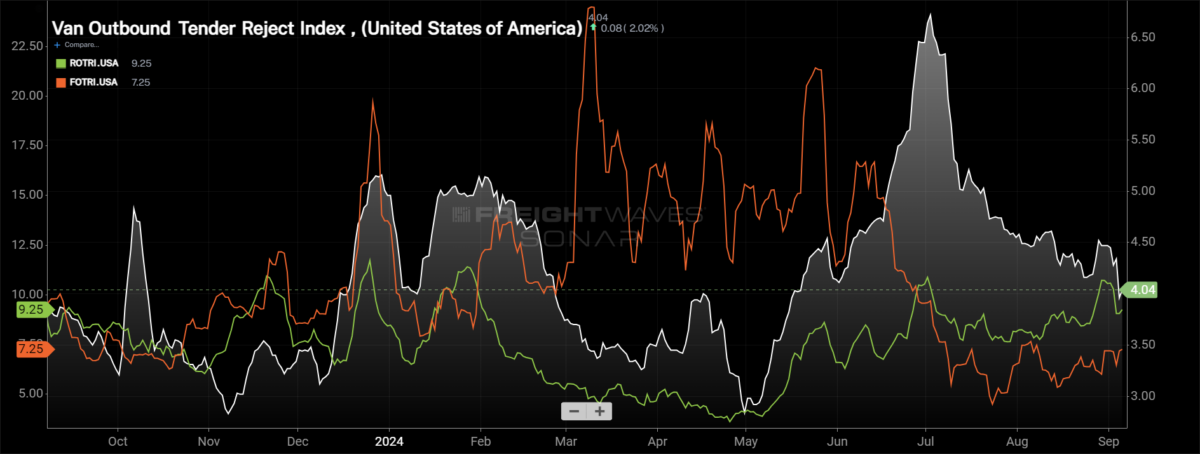
By mode: The dry van market experienced a sizable drop to kick off September, falling below 4% briefly. The Van Outbound Tender Reject Index fell by 43 basis points over the past week to 4.04%, the lowest level since mid-May. Even with the tough start to September, van tender rejection rates are 24 basis points higher than they were this time last year.
The reefer market has been getting subtly tighter since mid-May as reefer tender rejection rates have been inching higher. The Reefer Outbound Tender Reject Index did fall this week by 148 bps, but it is up 150 bps over the past month to 9.25%. Now, the reefer market typically has rejection rates above 10%, so that is a crucial level for reefer rejection rates in the coming months. At the moment, reefer tender rejection rates are 80 bps higher y/y.
The likelihood of lower interest rates in the coming months has led to a slight increase in flatbed activity. Over the past week, the Flatbed Outbound Tender Reject Index increased by 125 basis points to 7.25%. Flatbed tender rejection rates are up 32 basis points month over month, but the higher interest rate impacts continue to weigh on the market as flatbed rejection rates are 236 bps lower y/y.
Spot rates fade despite Labor Day holiday
As capacity remained abundant leading into and following the Labor Day holiday, spot rates are still under pressure. Spot rates have fallen to the lowest level since mid-May, which ultimately sets the baseline lower leading into traditional peak season. The next two months will be pivotal to try to reverse the current momentum in the market, which will only come from a continuation of capacity exiting the market and the record import levels flowing into the truckload market.
To learn more about FreightWaves SONAR, click here.
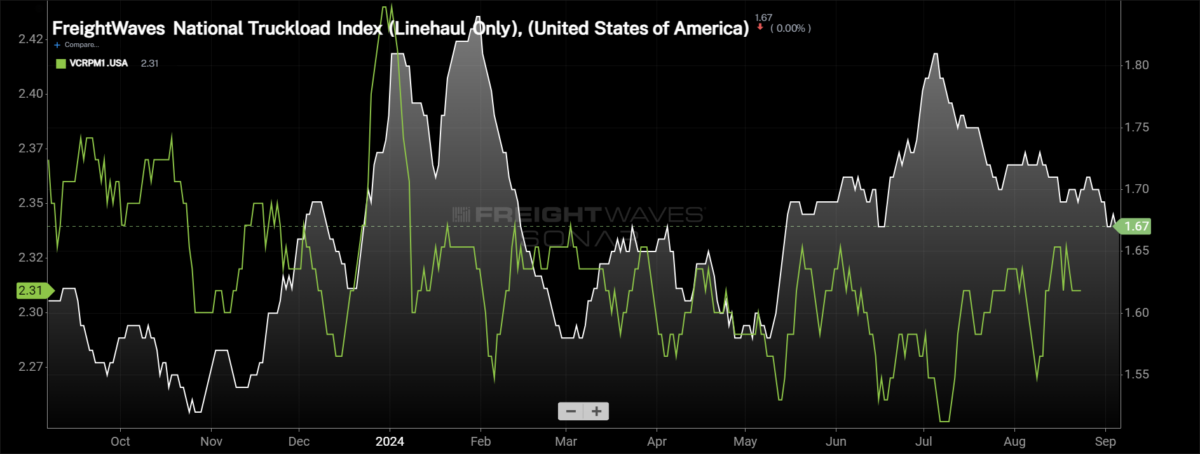
This week, the National Truckload Index — which includes fuel surcharge and various accessorials — fell by 2 cents per mile from the week prior at $2.25 per mile. With the declines throughout August and a muted reaction to Labor Day, the NTI is now 6 cents per mile (2.6%) lower than it was this time last year. The linehaul variant of the NTI (NTIL) — which excludes fuel surcharges and other accessorials — was also down 2 cents per mile this week at $1.67. The NTIL is still 5 cents per mile higher than it was at this time last year. The discrepancy in the NTIL and NTI is solely the changes in fuel, which was far more expensive in 2023 than currently. The average diesel truck spot price per gallon is 76 cents per gallon, or 17%, lower than it was last year.
Initially reported dry van contract rates remain in a fairly tight range, rising by 3 cents per mile over the past week to $2.31. Throughout 2024, contract rates have been in a tight range, an indication that the extreme cost savings are in the rearview mirror and service is now coming to the forefront. Initially reported contract rates are down 4 cents per mile from this time last year, about a 2% decline.
To learn more about FreightWaves SONAR, click here.
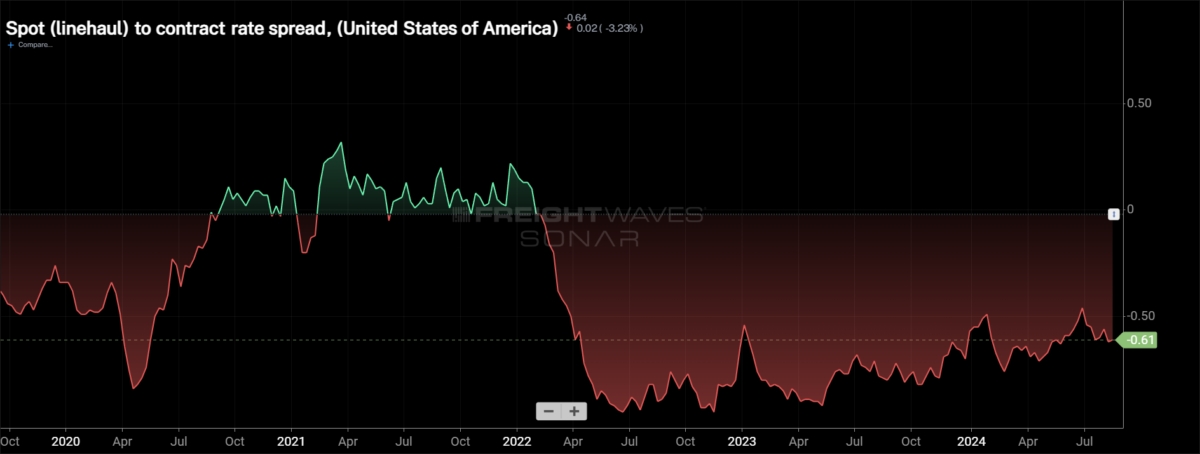
The chart above shows the spread between the NTIL and dry van contract rates is trending back to pre-pandemic levels. The spread widened over the past week as spot rates declined and contract rates rebounded slightly. The spread is now the widest it has been since early June and is still 20 cents wider than it was on average during 2019.
To learn more about FreightWaves TRAC, click here.
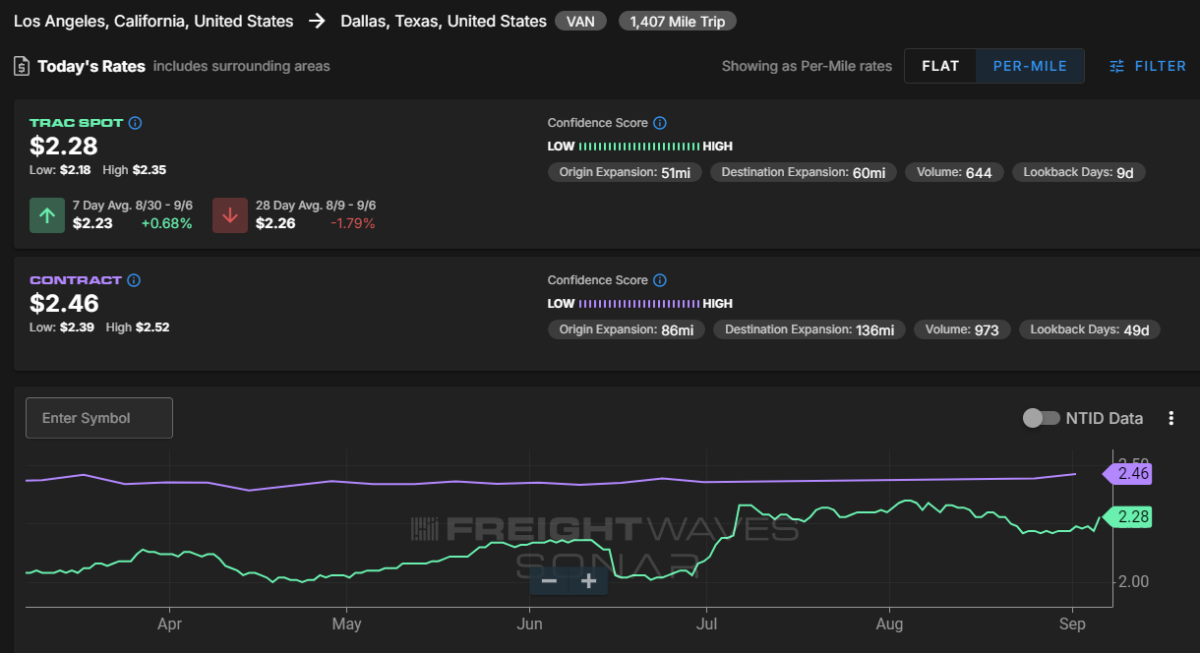
The FreightWaves Trusted Rate Assessment Consortium spot rate from Los Angeles to Dallas erased last week’s decline, rising 4 cents per mile over the past week to $2.28 per mile. At the moment, contract rates are just 18 cents per mile higher than the FreightWaves TRAC rate along this lane.
To learn more about FreightWaves TRAC, click here.
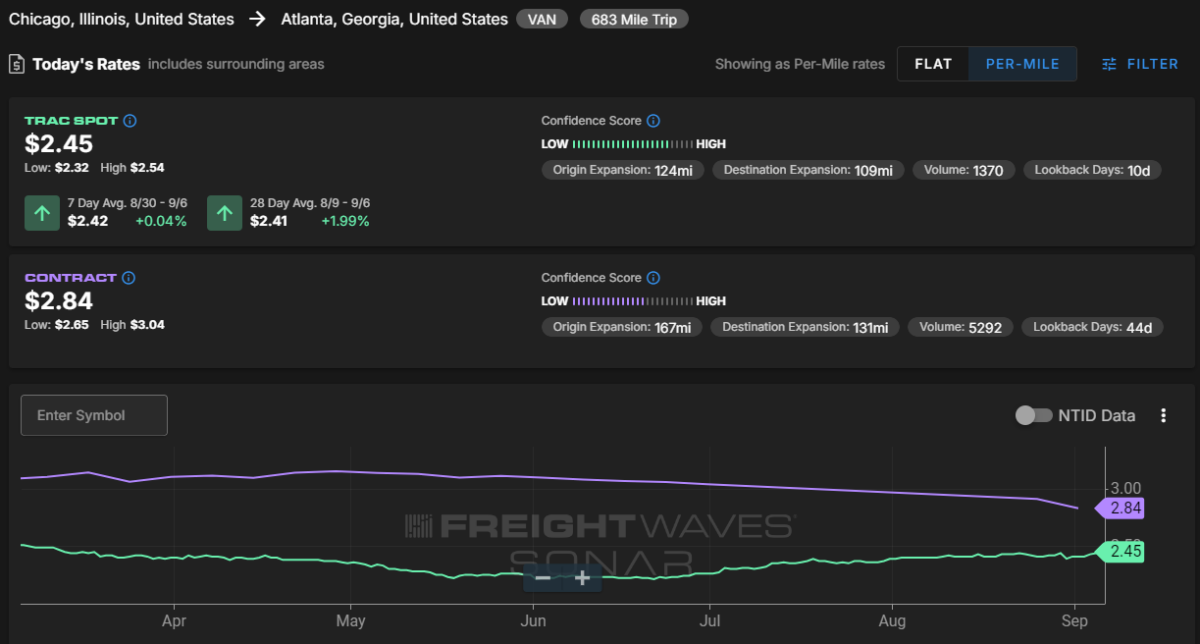
From Chicago to Atlanta, the TRAC rate continues to creep higher. It rose by 1 cent per mile to $2.45, the highest level since March 16. The spot rate on this lane is still 39 cents per mile below the contract rate.


